Topics covered in this chapter:
- Why the market has to move in waves in order to progress.
- The fractal nature of the market as expressed in the Elliot Wave Theory and in patterns inside other patterns.
- The Elliot Wave Theory as an example of why it is important to have an overview of what is happening in the market at any time.
- How to identify the behavior pattern of Elliot waves using some Fibonacci guidelines.
- How to define a trending and a non-trending market.
- Is the axiom “the trend is your friend” a reality for most traders? What we see in the chart is not what is seems to be and we shall understand why.
From the last chapter's section on market sentiment we understand that human flaws are consistent and measurable, and that being aware of that and utilizing this phenomenon can benefit a trader.
In the present chapter we will take a path away from the random walk and efficient market hypothesis to study the visual manifestations of market psychology, expressed through chart patterns. As for the infinity of patterns which exist, the next pages could be easily transformed into an encyclopedia. There are dozens of standardized visual representations of market behaviors.
Instead we will focus on the most common patterns and relate them to the knowledge gained in previous chapters in a way you can create an edge. If you see a chart pattern forming and you want to buy or sell a currency pair, you can check this present chapter in the Learning Center and/or use the multiple links we give here to our contributors' work. This chapter is replete with pertinent illustrations and so are the many hyper links it contains. Following this lesson, you can learn more, refresh your memory on how to identify a pattern, or get tips about how to profit from it.
Chart analysis, or ‘charting’ as it is often called, is often considered the most basic component of price analysis. As such, it differentiates itself from technical analysis where advanced technical indicators are the means to determine price direction. Indicators such as moving averages, oscillators and so on, are undoubtedly of grand use to the technical trader, but chart patterns bring us again to the basics of supply and demand and market psychology.
1. Whose Friend is the Trend?
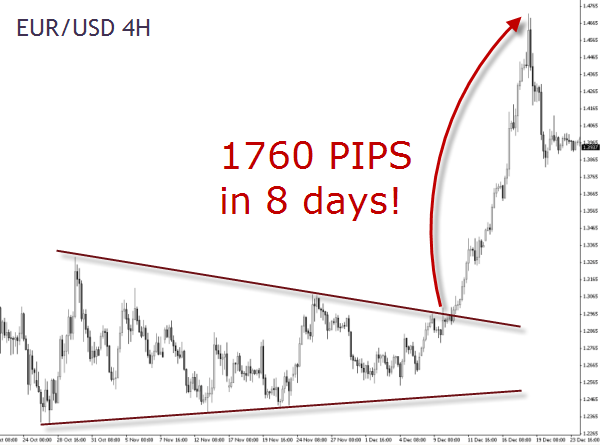
If you don’t think sentiment is what moves the markets then watch the below chart.
The EUR/USD pair was congested in a price range of roughly 1000 pips for over one month. The congestion became critical because it was narrowing as highs and lows on the chart were converging. A break above or below the lines and a subsequent move to the next significant resistance or support level would represent the first time in several weeks that the pair was considering trending. Many traders were waiting for this to happen.
With the break of the upper resistance line, the sentiment of the majority of the market participants gained on enthusiasm and the result was an extended move to the next significant resistance level.
Price patterns are visual representations of market psychology. They tell you when market participants feel enthusiastic about bringing the exchange rate to a certain level.
When you see a price pattern starting to form like on the above chart, you know the pair is consolidating and a breakout is eminent. This is the time when you take a step back to evaluate what may happen to it. You don't know when the currency pair is going to break out and in which direction, but that doesn't mean it's not tradeable.
Price patterns like the above one - and specially with such an outcome – need first to be identified, measured and then traded upon. Along these three steps, the trader needs to be prepared to deal with the subtle nuances and occasional ambiguity that price patterns manifest, because not all situations are so clear as the above example.
Moreover, price action (any price movement) is probably not what it seems to be in the first instance. While the movement of price is influenced by human emotions, emotions aren’t the only driver. When looking at a chart like the above EUR/USD, we might think that traders started to buy because the price broke out of the congestion. That sounds logical: if there is an influx of new buying overwhelming the selling interest (meaning all the potential sellers have already sold and none is left at current prices), then the price goes up. But in order to really understand what moves prices one should also think of this mechanism the other way around.
To accomplish it, let's shortly review our lesson on supply and demand because these straightforward forces also play a meaningful part of price action. Remember: if there’s more demand than supply then prices are going to rise. Emotions will tend to slow down or accelerate that process, but the underlying force is supply and demand.
The other way to understand price movements is actually considering a price move as the lack of buyers or the lack of sellers at a certain level. The way most people think is that prices rise because of an increase in demand, but it’s only part of the equation. Think about what gets you into a trade. Probably you get in a trade in reaction to price moving in a certain direction or motivated by a contrarian move trying to bet on a turn in the price move. Either ways, your decision is emotionally reactive to what the market is doing. Now, think on the ways you decide to place your stops, which technically are also orders to be executed. Do you think your reactions and decisions differ very much from the vast majority of traders watching the same charts as you?
We should consider that such a move like the above one on the EUR/USD has been profited only by few people in its totality, and that price moved because there was a lack of sellers. From this perspective you probably get a completely different picture of the market reality, don't you? The above move can also be recorded on the chart even if only one buyer is left at the breakout point. Only one buyer is needed to move price up, if there is no other seller accepting that price. In other words, if there is insufficient selling interest at a given price to offset the buying interest, then prices move up to find sellers at higher levels.
The dynamic behind breakouts is that the price has to move higher to find the selling interest to match the buying interest. This was specially true in the above example: during the month of December 2008 liquidity was low as most institutional traders were in the process of closing the year, so probably only a few participants profited from that move.
Theoretically, all you need to do is to measure where those places are with a higher imbalance between buyers and sellers, and you could then be a profitable Forex trader. This subject is covered in Chapter 4 of Unit A and in more detail in the Practice Chapter.
When looking at the charts, have you ever heard a voice in your head saying: “This trend can’t keep going. This move has to be over now.”? If you find yourself in such a situation most likely you are too late to get in, and entering the market at that stage is the worst risk/reward scenario.
In a Q&A presentation called “A Study of Price Behavior”, Mike Baghdady states that the most important question to answer before making any trading decision is to ask yourself if the market is “trending” or if it is “correcting”. This is known in Elliott Wave terms as “motive impulsive” “or “corrective impulse” as we will see further below.
The very first question whether the market is showing a trending or a corrective impulse should help the trader identify what trading type to employ. Generally speaking, in a “trending market” you should be trading the so-called “continuation patterns” and in a “correcting market” you should be trading “reversal patterns”.
Mike lists a series of market observations which are extremely interesting. They appear in a new light when considering price movement like mentioned in the previous section.
“- Price moves in trends, trends move in waves – we have “impulse” waves in the direction of the trend, followed by “countertrend moves” better named “corrective waves”.
(Just by accepting this simple truth that prices NEVER move in a straight line, you will stop trying to pick tops or bottom and view the corrections instead as an opportunity to take a trade in the direction on the trend)
[…]
- Usually, movements in the market tend to have a relationship to each other. Price will alternate between areas where prices have been marked up to a new higher level or marked down to a lower level, and after a big move in either direction price will consolidates at that new price level
- Trends usually begin from low volatility sideways or contracting price zones. Trends start from an area of price equilibrium. Once there is an increase in demand, prices breakout of this equilibrium area and are bid higher or “marked up” to the next level where the market consolidates at the new equilibrium zone. (the opposite is in a down market)
[…]
- A loss in momentum is NOT a sign of trend reversal, it is merely a pause. The loss in momentum and volatility is because buyers and sellers now agree to the new established price level or the new level of equilibrium. They will continue to buy and sell within a narrow range which is known as backing and filling, thus forming some of the known patterns like triangles, ledges, flags etc.
- The breakout in between equilibrium zones offers the trader the biggest profit potential.”
If prior to enter a trade you train your mind to assess all these aspects and watch price action as a supply-demand relationship, your thoughts will be focused on what is the next best trade opportunity rather than on the disbelief of how far a move is going. Pierre Charlebois mentions in one of his blog posts related to trading psychology:
“What happens to our minds in cases like this is as the move goes deeper and deeper we go into a state of disbelief almost, about how far the moves are going. So we want to benefit from the move but part of our minds won’t allow us to jump into a trade in the current direction because it’s akin to jumping onto a moving train. So we watch, thinking that the move will be over soon and that we can catch the counter trend rally. What usually happens here is we do this far too soon and we are stopped out or go negative on our trades at which point we start adding to average down and find ourselves fighting a tide that turns into a tidal wave.”
Trying to predict where prices are going to form tops and bottoms without the proper knowledge will make you lose money. Why? Because you will be relying on hope and fear and that’s not advisable in currency trading. A much better approach if you want to trade with the trend is to wait for the market to confirm a trend is under way, and only then decide to enter the market. By trading with price momentum on your side, you have the odds in your favor.
Pierre Charlebois shares with us his understanding of market behavior in terms of ebb and flows. Like every seasoned trader, he has also made is compendium of beliefs about the market, and although it may seem just a simple observation, the fact is that such a perspective can only settle down in the trader's psyche after a large experience in trading.
“How many times do you find yourself trading against the current market sentiment? Are you long when the market is going short? Are you trying to trade a trend when the market is range bound?
If you know something about tides you know that there are smaller ebb and flows as well as much larger highs and lows. Think of the market as tidal so that you don’t find yourself trying to swim against the tide.
The two most important questions that I have had to learn to teach myself to ask before every trade (trading session) are:
- What is the general sentiment of the market – (Range-bound or trending)
- What is the current session sentiment – (Up or down)
When I feel reasonably confident I can answer these questions for myself, then I decide to go long or short. Otherwise what I tend to do is see every correction as a potential reversal. This causes me to try and trade against the tide.
So what I focus on is:
- Buy on dips in a rising market
- Sell on tops in a falling market”
Based on all the above insights we can state that markets are rarely at extreme values, either in terms of supply and demand or in terms of emotional state of its participants. It is more likely that prices spend most of the time somewhere moving along the path from one extreme to the other. Knowing that the same phenomenom unfolds on different time frames means that there are still many opportunities to profit from.
If you have attended any of our daily webinars (online free seminars) in the live section, then you probably noticed there are two common ways to approach trading. One is trend following and seeking profit by capturing the directional moves which occasionally happen in the markets. The other is based on the idea that markets tend to spend more time moving sideways in ranges than they do trending.
This, of course, is very much subjective and depends on the perspective of the analyst or trader. Even during a so-called “range market” situation, the trader can witness trending situations when going into shorter time frames. But for practical purposes though in a given time frame there are only the two market conditions. In an article by John Needham published in the Trader's Journal we can read:
“Trend can never be talked about without qualifying the timeframe. An uptrend on a daily chart may not give you the correct trend on a weekly chart, let alone a monthly chart. For practical purposes, we use the next highest timeframe to define trend. As I trade primarily from a daily chart, this means that I am cognizant of the weekly trend. If there is a strong trend in place, then only trades in the direction of that trend will be considered. If the weekly chart is consolidating, then I will take Danielcode trades both ways.”
Our purpose is to gear you with tools to trade in either condition: trending and ranging. To trade successfully with trends, the ideal is to have a way to enter the directional move near its beginning and exit it near its end. But more than often this doesn't happen. When we see a big move like in the above EUR/USD chart, we tend to imagine how much money those who picked the complete move may have gained. But in reality, only very few participants were able to catch the entire move and those who accomplished it will not see it happens again so soon.
It is not realistic to expect to pick the exact beginning and end of a major trend, but it is possible to catch a large portion of it and make good profits. This is the closest definition of trend trading.
Many aspiring traders associate trend trading to long-term trading. But as we said before, it’s just a question of time frame. There can be trends in all trading periods, from daily charts to one minute chart. Besides, supply and demand isn’t just a long-term market dynamic. It happens in the short-term in the same manner as in the long-term.
David Aranzábal is a good example of a trader who is able to catch the “meat” of the intraday trends using 1 minute charts. His exemplary tradelog, is worth seeing if your are interested in drilling down to the 1 minute world.
Dave Floyd shares with us his approach on how to identify a trend. Take your time to go over the material as true gems are hidden in those articles.
How to Correctly Identify the Trend - Part I
An interesting macro approach is presented in these two videos by Don Wilcox. Don covers the use of the ADX and moving averages as tools to find out the difference between a “trend reversal” and a “retracement” within a trend.
Opposite to trend trading, the so-called “range-bound” or “range” trading is about defining a range and making trades near its boundaries. This means to sell near the top of the range and buy near the bottom to capture profits when the market moves from one end to the other.
There are advantages and disadvantages associated with both approaches which will be discussed more in detail when covering trading strategies in Unit C. For now let's concentrate in the analysis and based on these tools keep constructing a personal market perspective.
Looking at a chart and seeing what is going on is usually the difference between success and failure in trading. Most novice traders look at charts, yet they see either very little or they over analyze what they see.
All charts are telling a story to the trader or analyst who has acquired a personal way to look at the market. It does not necessarily mean to see what is “really” going on, because the complete reality is impossible to understand. This is especially true when dealing with the complexity of today’s financial markets.
The story revealed in the chart tells the trader where is the most probable next move in the market and when it shall happen. The educated trader will then determine if the story aligns with his or her money management and chooses to get involved or not get involved. For now we will not enter into managing the equity - instead we will concentrate on what analytical tools have that inherent capacity of narrating us a story. What tools have the capacity to put the trader figuratively on top of the market, with a panoramic view of the unfolding battle between the forces of supply and demand? Elliot Waves have those attributes of pointing out the direction and at the same time of timing crucial turning points - sometimes even with a mind-boggling accuracy.