Topics covered in this chapter:
- How to recognize early signals for market turns.
- 12 patterns that will create more trade situations you can use in your benefit.
- Extra edges by knowing the variations of candlesticks as they apply to Forex.
- How to contextualize candlestick patterns combined with western techniques.
- A guide through some invisible aspects of the Forex market: sentiments and order flow.
In previous chapters you have learned that charts are useful to forecast price movements by recognizing either patterns and trends or signals given by technical indicators.
A chart is primarily a graphical display of price information over time. Technical indicators and trendlines can be added to it in order to decide on entrance and exit points, and at what prices to place stops.
All these charts can also be displayed on an arithmetic or logarithmic scale. The types of charts and the scale used depends on what information the technical analyst considers to be the most important, and which charts and which scale best shows that information.
If your interest is a qualitative view of the market, because you want to display data that have had a large percentage of increase or decrease in price, usually longer-term charts, then it is more appropriate to use a logarithmic chart.
While the arithmetic shows price changes in time, the logarithmic displays the proportional change in price - very useful to observe market sentiment. You can know the percentage change of price over a period of time and compare it to past changes in price, in order to assess how bullish or bearish market participants feel.
However, in the Forex market, the arithmetic scale is the most appropriate chart to use because the market doesn't show large percentage increases or decreases in the exchange rates. On an arithmetic chart equal vertical distances represent equal price ranges - seen usually by means of a grid in the background of a chart. The arithmetic scale is also the most appropriate to apply technical analysis tools and detect chartist patterns because of its quantitative nature.
Besides the arithmetic scale, the Forex world has also adopted the Japanese candlestick charts as a medium to access a quantitative as well as a qualitative view of the market. They were chosen among other types of charts - the two most common being the “line chart” and the “bar chart” - because of their attributes as we shall see throughout this chapter.
1. A Way To Look At Prices
The line chart is the simplest form of depicting price changes over a period of time. The line is graphed by depicting a series of single points, usually closing prices of the time interval. This simple charting method makes easier the assessment of the direction of a trend, or the comparison of the prices of multiple instruments on the same graph, but it also complicates the spotting of reversal levels.

The bar chart, in turn, is a form of displaying prices over time. It depicts a set of four data points for a given period of time for a financial instrument and embeds them in bars - hence the name. The four data points depicted are the open, the close, the high, and the low prices, that's why sometimes it's called the “OCHL chart”.
The high price is represented by the top of the bar and the low price is represented by the bottom of the bar. The open and close prices are the so-called “tick marks” drawn horizontally at the left and right sides of the vertical bar. Although they carry more information on price action, bar charts are not as good to examine market sentiment.
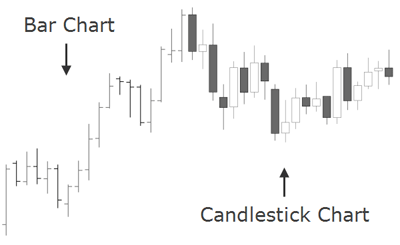
The Japanese candlestick chart is considered to be quite related to the bar chart as it also shows the four main price levels for a given time period.
So, what makes them the favorite chart form among most Forex traders? The answer is that candles have a lot of qualities which make it easier to understand what price is up to, leading traders to quicker and more profitable trading decisions.
Japanese candlestick charts are believed to be one of the oldest types of charts, developed in Japan several centuries ago for the purpose of price prediction in one of the world's first futures markets.
In the 18th century, Munehisa Homma become a legendary rice trader and gained a huge fortune using candlestick analysis. He discovered that although supply and demand influenced the price of rice, markets were also strongly influenced by the emotions of participating buyers and sellers.
Homma realized that he could capitalize on the understanding of the market's emotional state. Even today, this aspect is something difficult to grasp for most aspiring traders. Homma's edge, so to say what helped him predict the future prices, was his understanding that there is a vast difference between the value of something and its price. The same difference between price and value is valid today with currencies, as it was with rice in Japan centuries ago.
Compared to the line and bar charts, candlesticks show an easier to understand illustration of the ongoing imbalances of supply and demand. They also speak volumes about the psychological and emotional state of traders, which is an extremely important aspect we shall cover in this chapter.
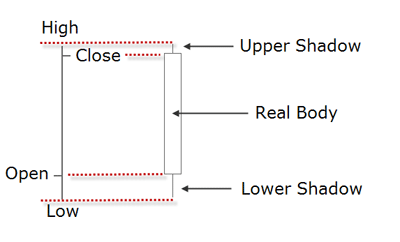
One advantage that Forex candlestick charts may provide is that candles are colored accordingly to the direction of price movement: when the open rate is higher than the closing rate the candlestick is colored with a “filled-in” body, and when the candlestick shows a “hollow” body, that means the closing rate exceeds the opening rate. The body of the candlestick, also called the “real” body, represents the range between the open and closing prices. In a quick view, you notice in which direction, if any, the price is heading. This is just one of the multiple conventions and the one we will use here, as each charting service may color the bullish and bearish candles differently.
Below is an example of candlesticks and a definition for each candlestick component. The solid part is the body of the candlestick. The lines at the top and bottom are the upper and lower wicks, also called tails or shadows. The very peak of a candle's wick is the highest price for that time period, while the bottom of the wick is the lowest price for that particular time period.
Another advantage of using a candlestick chart is that it's suitability to be used together with other technical tools. You may combine them with conventional market indicators such as moving averages and trendlines. But the most outstanding advantage these charts offer are the early warning signs when changes in trends occur.
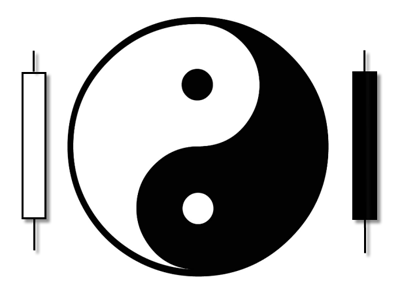
Traditionally the Japanese attribute yang qualities (expansion) to bullish candles and yin qualities (contraction) to bearish candles. When the yang reaches an extreme there is stillness, and stillness gives rise to yin. A reversal in market forces follows the same principle: a tall bullish candle showing a yang quality gives rise to stillness expressed in the small real body of the following candle; and the stillness gives rise to yin, which emerges in the form of a long bearish candle that completes the reversal pattern. This balance between ying and yang forces is another way to look at swing movements in price similar to the wave principles covered in the previous chapter B03.
Candles can be used across all time frames — from intraday to monthly charts. For example, on a weekly chart, an individual candle line would be composed of Monday's open, Friday's close and the high and low of the week; while a four hour candle would comprise the same price levels for that time period.
Common Candlestick Terminology
Some traders seem put off by the language that surrounds candlestick charts. But it's quite simple actually: the names of the patterns will often tell you what message is inherent to it. Originally, candlestick formations were labeled accordingly, in part, to the military environment of the Japanese feudal system during that time. Therefore you will find terms such as as “piercing”, “thrusting” and “advancing three soldiers” which definitely reflect a military cast. But candles were also given other more mystical names which may sound unusual at first but which are actually very descriptive like the “dragon fly” or “morning star”. Steve Nison, in one of his books about the topic, explains:
A fascinating attribute to candle charts is that the names of the candle patterns are a colorful mechanism describing the emotional health of the market at the time these patterns are formed. After hearing the expression “dark-cloud cover”, would you think the market is in an emotionally healthy state? Of course not! […] this is a bearish pattern and the name clearly conveys the unhealthy state of the market.
[…] The descriptive names employed by the Japanese not only make candle charting fun, but easier to remember if the patterns are bullish or bearish. For example,[...] the “evening star” and the “morning star”. Without knowing what these patterns look like or what they imply for the market, just by hearing their names, which do you think is bullish and which is bearish? The evening star (the nickname for the planet Venus), which comes out before darkness sets in, sounds like the bearish signal - and so it is! The morning star, then, is bullish since the morning start (the planet Mercury) appears just before sunrise.
Source: “Japanese Candlestick Charting Techniques, A Contemporary Guide To The Ancient Investment Techniques Of The Far East” by Steve Nison, Prentice Hall Press, Second Edition, 2001.
Out of a universe of dozens of candlestick patterns, it has been found that a small group of them provide more trade opportunities than most traders will be able to utilize. In this section, 12 patterns are dissected and studied, with the intention to offer you enough insight into a fascinating way to read price action.
The following is a list of the selected candlestick patterns.
MARUBOZU
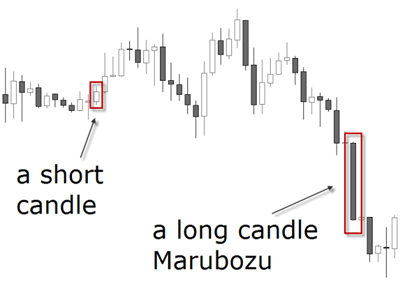
Although this candle is not one of the most mentioned ones, it's a good starting point to differentiate long candles from short candles. A marubozu is a single candlestick pattern which has a very long body compared to other candles. Although this is considered a confirmation of the market's direction, it suggests to enter the move when the price has already moved a lot. The resulting risk associated with this signal makes the marubozu not so popular compared to other candlesticks.
It signals a strong buying when the close is significantly above the open, and vice versa when the candle is bearish.
A short candle is of course just the opposite and usually indicates slowdown and consolidation. It occurs when trading has been confined to a narrow price range during the time span of the candle. The smaller the real body of the candle is, the less importance is given to its color whether it is bullish or bearish. Notice how the marubozu is represented by a long body candlestick that doesn't contain any shadows.
DOJI
When confronted with a doji candlestick pattern, the Japanese say the market is “exhausted”. The doji also means the market has gone from a yang or ying quality to neutral state. In western terms it is said that the trend has slowed down - but it doesn't mean an immediate reversal! This is a frequent misinterpretation leading to a wrong use of dojis. Despite the odds of a market turn increasing with a doji, it still lacks a confirmation to be traded upon.
Doji's are formed when the session opens and closes at the same level. This pattern indicates there is a lot of indecision about what should be the value of a currency pair. Depending on the shape of the shadows, dojis can be divided into different formations:
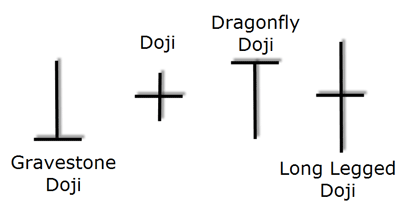
A long legged doji candlestick forms when the open and close prices are equal.
The dragonfly doji shows a session with a high opening price, which then experiences a notable decline until a renewed demand brings the price back to finish the session at the same price at which it opened. At the top of a trend, it becomes a variation of the hanging man; and at the bottom of a trend, it becomes a kind of hammer. It is thus seen as a bullish signal rather than neutral.
The gravestone doji's are the opposite of the dragonfly doji. Appropriately named, they are supposed to forecast losses for the base currency, because any gain is lost by the session's end, a sure sign of weakness. The Japanese analogy is that it represents those who have died in battle.
Dragonfly and gravestone dojis are two general exceptions to the assertion that dojis by themselves are neutral.
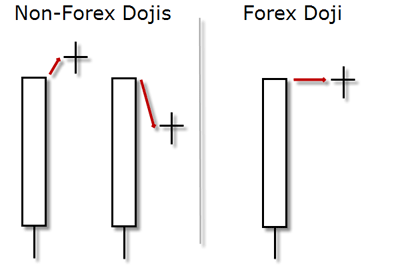
In most Candle books you will see the dojis with a gap down or up in relation to the previous session. In Forex, nonetheless, the dojis will look a bit different as shown in the picture below.
SPINNING TOP
In Forex, you may consider the doji and the spinning top as having the same potential for reversal. For example, if a market makes a new high as shown in the image below, and does so with a doji or a spinning top — that’s a small real body with a long upper and lower shadow — the signal is the same: the market rejected the higher levels and shows indecision as where to proceed.
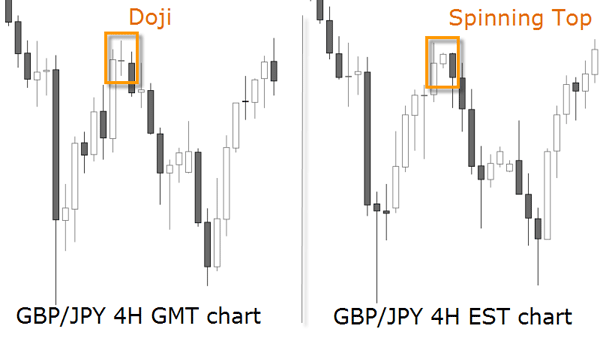
How can I deal with the fact that different charting platforms show different candlestick patterns because of their time zone?
Forex market, we would suggest to use a GMT chart since most institutional volume is handled in London. This is specially valid if you work with daily charts but intraday charts superior to 1 hour will also show differences in the patterns. In any case, because of the 24 hour nature of the Forex market, the candlestick interpretation demands a certain flexibility and adaptation. You will see how some of the textbook patterns look slightly different in Forex than in other markets.
The following patterns are thought to alert the trained eye of pending reversals offering the chance to the trader to get early on a possible new trend, or to alert the trader who is already in the money that the trend is ending and the position demand to be managed.
ENGULFING PATTERN
Many single candlestick patterns, such as dojis, hammers and hanging man, require the confirmation that a trend change has occurred. They become more significant to the market when they fulfill the following criteria: they have to emerge after an extended period of long bodied candles, whether bullish or bearish; and they must be confirmed with an engulfing pattern.
This pattern occurs when a candle's body completely engulfs the body of the previous candle.
A bullish engulfing commonly occurs when there are short-term bottoms after a downtrend.
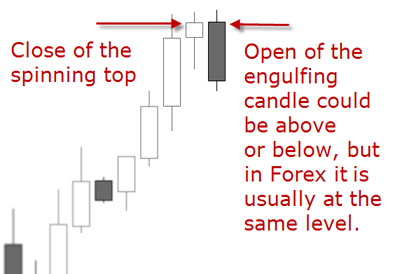
In Forex, a bullish engulfing will seldom open below the last candle's close, but usually at the same level. But a bullish engulfing will always close above the previous candle open price, and a bearish engulfing will always close below the previous candle open price. See below the picture of a bearish engulfing pattern for a better understanding:
When engulfing occurs in a downward trend, it indicates that the trend has lost momentum and bullish investors may be getting stronger.
Conversely, a bearish engulfing will occur when the market is at the top after an uptrend.
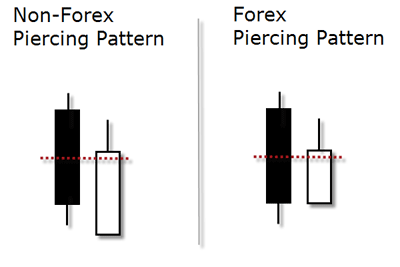
PIERCING PATTERN
This pattern is similar to the engulfing with the difference that this one does not completely engulfs the previous candle.
It occurs during a downward trend, when the market gains enough strength to close the candle above the midpoint of the previous candle (note the red doted halfway mark). This pattern is seen as an opportunity for the buyers to enter long as the downtrend could be exhausted.
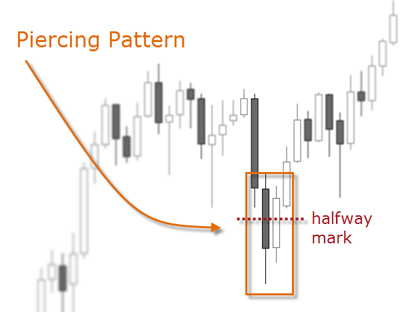
A piercing pattern in Forex is considered as such even if the closing of the first candle is the same as the opening of the second candle.
DARK CLOUD COVER
This pattern is the exact opposite of the piercing pattern. It happens during an upward trend when the session opens at or slightly above the previous closing price, but the demand can't be sustained and the exchange rate loses ground falling below the midpoint of the previous candle.
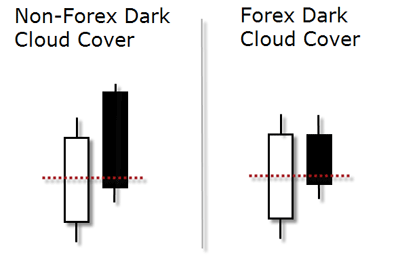
This pattern indicates the opportunity for traders to capitalize on a trend reversal by position themselves short at the opening of the next candle. It may also be used as a warning sign for bullish positions as the exchange rate could be entering a resistance zone.
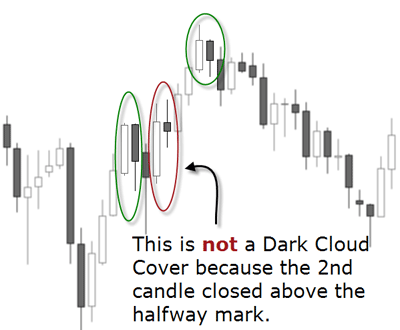
The below chart shows some distinctions between “real” and “false” dark cloud covers. While the green circled patterns fulfill all the recognition criteria, the red circled don't.
HARAMI
On a Japanese Candlestick chart, a harami is recognized by a two-day reversal pattern showing a small body candle completely contained within the range of the previous larger candle's body. This formation suggests that the previous trend is coming to an end. The smaller the second candlestick, the stronger the reversal signal.
On a non-Forex chart, this candle pattern would show an inside candle in the form of a doji or a spinning top, that is a candle whose real body is engulfed by the previous candle. The difference is that one of the shadows of the second candle may break the previous candles extreme.
In Forex charts though, there is usually no gap to the inside of the previous candle. This is how the differences look like:
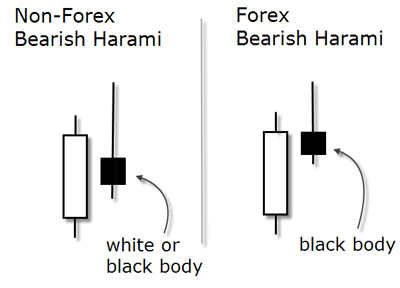
The harami pattern can be bullish or bearish but it always has to be confirmed by the previous trend. An important criteria in a Forex chart (as opposed to a non-FX chart) is that the second candle has to be of a different color than the previous candle and trend. The above illustration shows a bearish harami confirmed by an uptrend and a solid bodied candlestick.
The larger prior candle shows a clear direction but once the hesitation of the harami is printed on the chart, it requires a confirmation as to where the market is heading from now. Later in this chapter we will see how to get a confirmation of candlestick patterns.
HAMMER
There are few patterns where the shadows play a major role than the body. One of these are hammers, which is comprised of one single candle. It is called so because the Japanese will say the market is trying to hammer out a base. A hammer pictorially displays that the market opened near its high, sold off during the session, then rallied sharply to close well above the extreme low. Note it can close slightly above or below the open price, in both cases it would fulfill the criteria.
Because of this strong demand at the bottom, it is considered a bottom reversal signal.
A perfect hammer in Forex is the same as in any other market: its tail must be twice as large as the length of the body and the body has to be near or at the top of the candle. This means it can have a little upper shadow, but it has to be much smaller than the lower shadow.
The smaller the body and the longer the tail, the more significant the interpretation of the hammer as a bullish signal. Another important criteria is the color of the body: the candlestick can be bullish or bearish, it doesn't matter.
Most patterns have some flexibility so much more illustrations would be required to show all the possible variations. This is what we attempt to do in the Practice Chapter. The illustration below is a sample question taken from the Practice Chapter's assessment. There you will find dozens of real case studies to interpret and answer. Each example will show a detailed explanation of the correct answer so that you can really integrate this knowledge in your trading. Remember: practice is one of the keys to success in Forex trading.
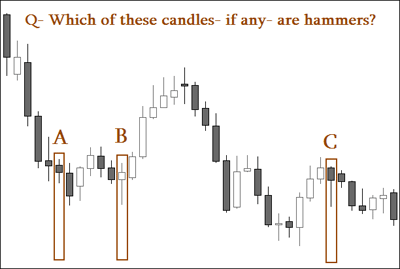
Answer: “A” is not a hammer because the lower shadow is not twice as large as the real body. Other criteria, such as the real body at the upper end of the trading range or the preceding downtrend, are fulfilled.
“B” is a valid hammer because it emerges after a downtrend and the lower shadow is at least twice as large as the real body. Other criteria, such as the real body at the upper end of the trading range or the preceding downtrend, are fulfilled. It can have a little of an upper shadow.
“C” is not a hammer because the preceding trend is up. A hammer always has to emerge after a downtrend. All the other criteria are fulfilled.
HANGING MAN
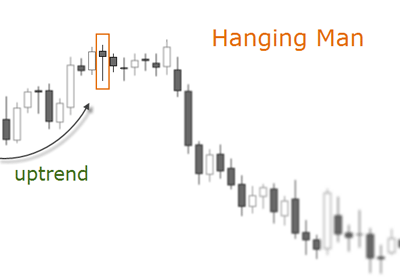
The hanging man is also comprised of one candle and it's the opposite of the hammer. If a hammer shape candlestick emerges after a rally, it is a potential top reversal signal. The shape of the candle suggests a hanging man with dangling legs.
It is easily identified by the presence of a small real body with a significant large shadow. A true hanging man must emerge at the top of an uptrend. All the criteria of the hammer are valid here, except the direction of the preceding trend. The body can be empty or filled-in; it may show a very small shadow on the top; the lower shadow has to be twice as large as the body; and the body has to be on the upper end of the trading range to be considered a bearish reversal signal.
Do candlesticks work across all time frames? Yes, they should work in all time frames because the market dynamic behind its construction is the same in higher charts than in lower ones. However, someone using a very short time frame like the one or five minute chart should be forewarned that there is more noise in small time frames, and that the opening and closing prices of these candlesticks aren’t as important as they are on a daily chart.
MORNING STAR
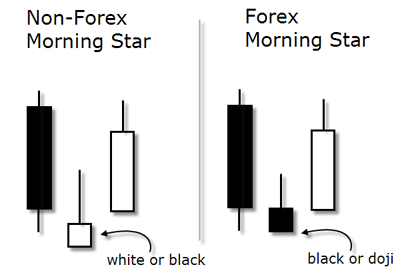
The classical morning star is a three-day bottom reversal pattern on a Japanese candlestick chart. Like the planet mercury, the morning star announces that the sunrise, associated with brighter events, is about to occur. In the first day of the pattern the exchange rate is still in a downtrend manifested through a long real body. The following candlestick has a small real body compared to the previous one. And finally, the last candle is a candlestick that reverts back more than halfway into the first candle's real body. It represents the fact that the buyers have now stepped in and seized control.
As for the validation criteria used in Forex, the middle candle, the star of the formation, has two different criteria as opposed to non-Forex environments: first, it doesn't have to gap down as it has to in other markets; second, its real body most of the time will be bearish or a doji.
There a quite some variations of the morning star, which are covered in more details in the Practice Chapter of this Unit.
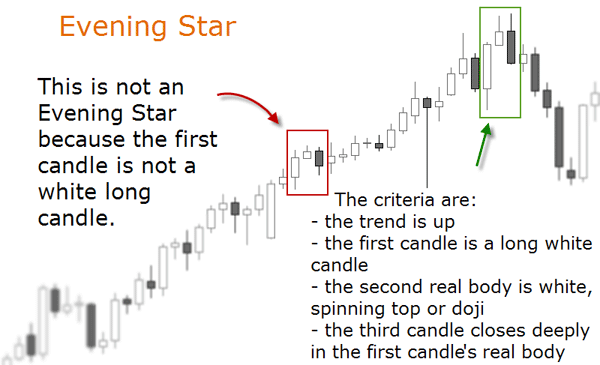
EVENING STAR
This pattern is the opposite of the morning star. It is recognized when the price stagnates after an upward trend and it does so in form of a small bodied candle. In Forex, this candlestick is most of the time a doji or a spinning top, preceding a third candle which closes well below the body of the second candle and deeply into the first candle's body. The first candle has to be relatively large in comparison to the preceding candles.
This candlestick pattern generally indicates that confidence in the current trend has eroded and that bears are taking control. The classic pattern is formed by three candles although there are some variations as we will see in the Practice Chapter.
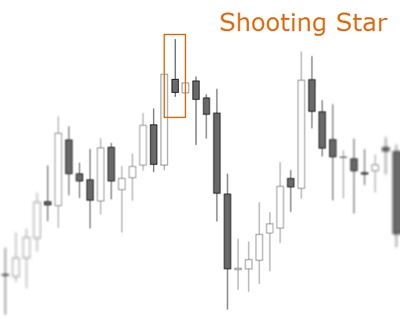
SHOOTING STAR
This single candle pattern has the following recognition criteria: it occurs when the exchange rate has been rising; the first candle has to be relatively large; the second candle has a small real body at or near the bottom of its range; and the upper shadow is twice as long as the body. On a Forex chart, the color of the candle is not a validation criteria.
The shooting star is a bearish reversal signal as its shape indicates that the price rallied during the session, but pulled back to the bottom to close near the opening price. This means that the initial demand pushed the price up, but sellers came in and imposed their supply.
Learning candle patterns in groups is much like recognizing family members. If a large number of relatives were disbursed in a crowd of strangers it would be easy to miss them. However, if the relatives were all brought forward and arranged by family units it would become rather easy to spot them, even if they were dispersed back into the crowd again.
Candlesticks, like relatives, can be grouped together and learned in family groups. They can be directly related or cousins. As in any family some of the cousins can be a bit odd, but in perspective they still fit and are much easier to remember if they can be placed into a family.
Candlestick patterns have very strict definitions, but there are many variations to the named patterns, and the Japanese did not give names to patterns that were “really close”. Experience and common sense allow traders to read the message even if it does not exactly match the picture or definition in the book.
Source: “Candlestick Charting Explained” by Gregory Morris, McGraw-Hill; 3 edition, 2006
The insights gained from dissecting each of these 12 major signals will become a valuable tool for learning how to use Japanese candlesticks. Let's see some trading applications!