Topics covered in this chapter:
- Original ideas to build your trading methodologies.
- A huge variety of trade set-ups to build strategies upon.
- Many trading edges rely on the details- get to know some of the finest nuances of from our contributors.
- How to simplify and dissect the theory until now accumulated.
The journey through the Learning Center has been long, and especially after the last two theoretical Chapters, we have chosen to prepare you a complete trading menu, replete with the most original trading recipes and the best ingredients.
Originally, the offer of our Education section was much simpler than the one we find today, especially in terms of technical scope and complexity. Nevertheless, an equal amount of care and attention was put into selecting the exposed topics. Since the beginning, FXstreet.com has worked with the best trading experts in the sector, sourced globally from all parts of the planet.
In this chapter we offer a sample of those educational webinars and articles that inspire the discourse of the Learning Center. Being able to offer a selection of some of the very best ideas and set-ups contained in our archives, without compromising each contributor's originality or what we think can be any essential ingredient for your trading, is a really stimulating challenge for our team.
Our objective is to convey all the technical and educational content in an organized and enthusiastic fashion. Far from deploying complete trading strategies, the following sections are a sample of the set-ups used by our contributors and those primary components that make their trading extraordinary.
What you are about to gain are incredibly effective set-ups; however, they must be used with common sense and geared with a certain amount of knowledge. If you haven't already studied the previous chapters we recommend you to do so.
Take your time to watch the videos linked throughout the chapter, since without them the content is of much less educational value.
1. Breakout Appetizers
Volatility Breakouts?
Volatility is a forward indicator and not a lagging indicator as most technical indicators are, in the sense that you have to wait for an event to occur before taking a position. Mark Whistler calculates volatility with the use of Bollinger Bands as they are, in fact, measurements of volatility and probability within a distribution.
This tool has the incredible capacity to indicate the total width of a distribution and gives us a probability of where the trading range will be. By their nature, the total width span of the Bollinger Bands increases when volatility starts to pick up. Because of this capacity to react to volatility and to be graphically shown when the distribution starts to expand, it can be considered a forward looking indicator. This is something that only few indicators do (Hichimoku Clouds are probably the only technical indicator that literally emerges ahead of price action). This means that you can estimate price level areas in the future by projecting the indicator a few candles to the right side of the chart.
We know from the study of Standard Deviations that 68% of the price action will be contained within the first standard deviation from the mean, 95% will be contained within the second deviation and 99,7% will be contained within the third deviation. This statistical data is immediately verified on the screen if you apply the Bollinger Bands to any price chart. This indicator has a particularity in which the distribution moves along with price because we have a movable mean. That movable mean is the Moving Average you can see in-between the outer bands. If you have the Bollinger Bands set to 50 periods, you get the movable distribution for the 50 periods - that is how it basically works.
The set-up herewith proposed consists of combining two different movable means: a shorter one, like a 14 period Bollinger Band, and another one set to 50 periods. Now you have a small subset distribution underneath a larger distribution.
The next step is keeping the third Standard Deviation for the shorter period and the second deviation for the larger period, so you get more intersections of both bands and subsequently also more crossovers between the bands. Ideally, the parameters should be 2,2 and 3,2 instead of just 2 and 3 deviations, and Mark explains why in his webinars.
By giving both distributions the correct distance we are able to identify volatility breakouts. When do these breakouts occur? They occur when short-term volatility compresses below the long-term volatility in times of lateral trading or consolidation. However, when the market starts to move again, short-term volatility spikes outside of the long-term volatility. These spikes are an early signal that the market will start to move. Remember, the market almost always gives the trader a first alert and second chance to enter. This technique is to be used to take profit of that.
In the webinar “Simple Trading Strategies to Perceive and Defeat Forex Volatility through Traditional Indicators”, Mark Whistler invites you to learn about the very nature of technical indicators and explore its essence. Only by doing so, you can really understand them and use them differently from the crowd.
The principle here is to observe the expansion and contraction of the Bands as a signal that trending or consolidation is on the way. This is a vital component of any trading system, so you can well integrate this reading into your trading models or start to build a model from this principle. This works because in order for the price to start moving, the short-term volatility has inevitably to expand outside of the longer one.
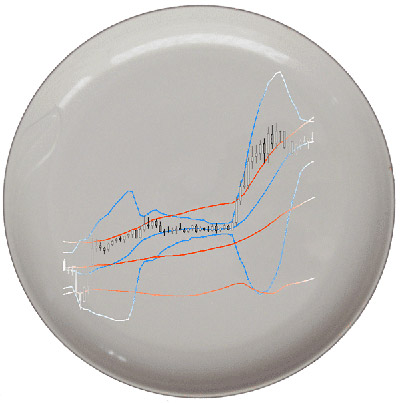
In order to fine-tune a long entry, for example, you have to check on a lower time frame and wait for the same set-up to appear in order to get a better entry level and confirm the position. A good tactic is waiting for the first pullback to the mean, because if the trend is resuming then we know that the mean will continue to hold.
Do you notice how we are just making use of the concepts so deeply studied in previous chapters? Great! Let's move on.
Drilling Down Support and Resistance
This is an interesting approach that attributes an enormous importance to horizontal S&R levels and price action in general. It requires a certain experience in Japanese candlestick reading, which you can get from Chapter B04 - although it doesn't require you to know the names of the candle patterns - and it capitalizes on small parcels of larger moves in between important levels. It can be considered a breakout tactic, perhaps more trend following than counter trend, although it is very technical in its aspects and not biased as to what direction is the market going to move.
It consists in a top down approach, identifying price boxes from where price can break out. To identify a box means to delimit the range where price is currently trading on a particular time frame and mark it on the chart. Then the trader switches to a lower time frame and finds an “inside” range within the larger one, in order to draw a new box. Triffany Hammond's set-up will enable to capture a price breakout of the smaller box and profit form part of the move towards the border of the bigger box. Since the borders of each box are recent support and resistance levels, any movement between them can be at least partially captured.
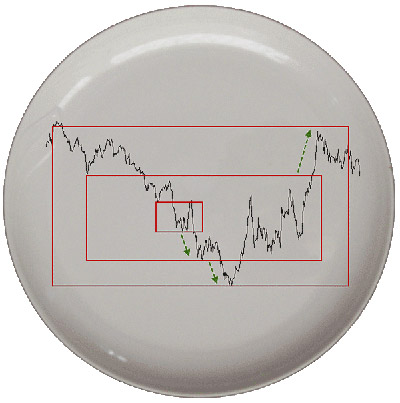
This is an example of how a simple set-up can be used in any time frame combination provided there is a planning exercise done in advance. In words of Triffany Hammond:
“Whatever time frame you're trading you can put a plan. Even if you are a scalper, there is no reason to be impulsive about your trades and have no plan. Get to know what a pair is likely to do, and what a pair normally does. If you don't know, you need to go back and practice on that pair and get a better feel for it. And as soon as that pair is not behaving “normally”, walk away from it, go and find a pair that is. There is nothing wrong with that.”
Drilling down, Support and Resistance, is one out of a series of webinars held by Triffany Hammond where she helps traders to identify current trading opportunities based on Support and Resistance analysis.
A Logical Entry Process
Phil Newton's business consists in capturing a parcel of the main movement of the day. The profit potential is given by the average day's move for the last hundred days using the daily Average True Range indicator.
Independently from the name of the pattern being formed on the chart and apart from main technical analysis theories, Phil's aim is to develop a logical process to arrange price action as displayed on a chart into manageable segments.
There is only three ways price can go: up, down, and sideways - the last one being the most forgotten. In his approach, Phil Newton developed a labeling of a price action sequence designed to read the current market direction and react to it instantly.
In this recorded webinar, Trading Strategy Essentials, Phil Newton introduces his methodology step by step and provides the keys to understand and profit the most from his regular webinars held at FXstreet.com.
The idea behind this technique is to allow the trader to enter the market without delay after a direction bias is confirmed by price action. If the trend has been down, thus making lower swing lows and lower swing highs in price, and suddenly prints a new higher high, this is the first signal alerting an eventual change of direction. If the next swing low is higher than the previous swing low and subsequently the next swing high is another higher high, the new market bias is objectively confirmed. At this stage, once the new market bias is confirmed the trader can enter the market when the last swing high is broken to the upside – assuming all the other conditions, if any, are favorable.
Until the market prints an opposite sequence of lower highs and lower lows and the last newest swing low breaks below the previous one, the direction is not considered to be changed and subsequently there is no condition to enter short.
It's always the break of the last consecutive swing high or low that validates the direction once it is broken. If it is not broken and the price resumes in the previous direction, the whole pattern is voided. Until a new directional bias is established the previous bias stays in force.
The upwards sequence can start either by a higher swing high or higher swing low, and the downwards sequence can also start either by a lower swing low or lower swing high. Besides, the market may also develop a sideways move by printing swing highs and lows below and above the most recent ones.
This method alone can be turned into a profitable strategy, no matter what currency pair or time frame used. It's based on the most simple definition - and many times overlooked - of what a trend basically is: a sequence of higher lows and highs (in case of an uptrend) and vice versa during a downtrend. Phil goes obviously further than the mere definition and puts rules to capitalize on this recurring price action.
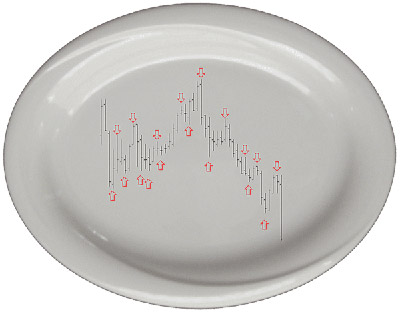
The picture above shows the first point in time when the price makes a bias change. As you can see on the chart, the entry is done on a breakout-pullback set-up. A short entry is set at least two pips below the most recent swing low, and a long entry at least two pips above the most recent swing high of the sequence. The stop loss goes past the event that makes us enter the trade, that is, the recent swing high/swing low sequence. Following the rule for stop placements, Phil developed a way to trail stops which is perhaps the most technical, price action sensitive way to trail stops. Watch the above video for more details!
Yen Pairs Love the Ichimoku Cloud
The Ichimoku Kinko Hyo is one of those indicators you should have at least an understanding of because of its originality compared to Western technical indicators. It is advisable to use this tool in the long-term on daily and weekly charts, where it best displays a panoramic view of what is happening with a certain currency pair.
One great thing about the Ichimoku Clouds, for instance, is that it doesn't need any filters as it has them already incorporated.
Another of its particularities is the clouds formed by the two moving averages projected 26 periods ahead in time: the Senkou Span A and Senkou Span B. This is a unique feature which most indicators don't have, the fact that they appear on the right side of the chart always several periods ahead of price. The clouds work as excellent dynamic support and resistance levels, especially in Yen pairs. The reason for this is understandable since the origin of the indicator is Japanese.
A third singularity of the indicator is the Chikou Span, a line which tracks the price movement 26 time periods back on the chart, providing – together with the clouds - a lecture on how current price action will act in reaction to its recent memory. That's awesome, isn't it?
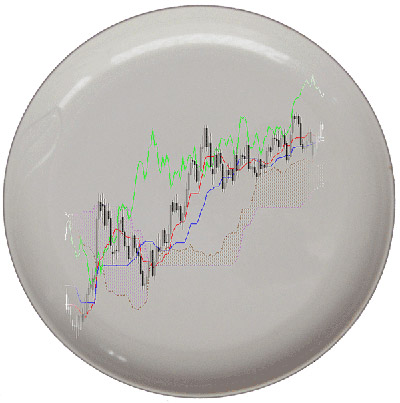
When price is inside the clouds it's said the market is ranging, and when it is above and below the clouds it's said to be trending up and down respectively. The signal the indicator generates is the crossover of the Tenkan Sen and Kijun Sen lines. One of the clues Valeria Bednarik teaches is that signals near to those areas where the clouds are thinner or even crossover their lines are much vulnerable for price penetration and thus much more reliable entry signals. Although a crossover in the direction of the cloud is considered a weak signal, it's usually an early entry if the projected cloud for the next session is thin.
The filtering process is done by the relative position of the Chikou Span line to past price action. This line will show more difficulty in crossing a congested region with up and down candlesticks than a row of unidirectional candlesticks.
If you tend to work better with visual elements of technical analysis, this indicator is definitely made for you. It goes without saying that a good knowledge of Japanese candlestick patterns is the ideal theoretical tandem. An exhaustive study is freely available Chapter B04 and dozens of case studies are to be find in the Practice B.
On Valeria Bednarik's author page, you will find several recorded webinars where she explains her set-ups and techniques.
Being a retail trader, do you belong to the sell or buy side of the market?
- Sell side
- Buy side
- Both as the Forex is a bi-directional market
Explanation: The correct answer is the “buy side”. The buy side is a technical term to label anyone who is attempting to make money on choosing a direction on any market or instrument, whether that is trending up or down. Such participants can be major funds, corporations, banks, and even central reserves if the purpose is to make profits or not to loose money by hedging. For these reasons, the retail trader is also considered to be on the buy side.
The sell side, in turn, is anyone trying to make money or providing liquidity to the ones who are trying to make money by choosing a direction up or down, that is, to the buy side. Therefore, the sell side can not exist without the buy side. These are the traders or computers who work order flow for massive institutions, market makers, brokerages and liquidity providers. This doesn't mean that retails have no chance of making money, on the contrary, you have some advantages the sell side doesn't have...
Feel tempted to keep reading? This is included in the Practice Chapter where you will not only put your knowledge to test but also gain additional insights!