Topics covered in this chapter:
- Get a deeper level of understanding by learning how to look beyond the charts and understand the supply, the demand and the order flow responsible for the creation of price action.
- How to look at charts without indicators.
- How to maximize gains and reduce risk with the precise identification of recurring price action patterns.
- More than 30 illustrations to help you recognize breakouts, reversals, pullbacks and gaps.
- Stop chasing the market and learn to anticipate the movements in the exchange rates with a proactive attitude.
- The most frequent mistakes aspiring traders do when supply, demand and order flow are not well understood concepts.
Understanding what is happening behind the scenes is the key to develop any trading method. Don't look at candles on your screen as just red and green pictures and patterns as they are the expression of supply and demand.
Understanding these concepts will make all the difference in your Forex trading career. It will give you the ability to trade based on what the market is expressing through price action. This resource can be useful to shift through the mountain of news and information that is produced every day and trade what you really see on the charts.
"What is Price Action?" is a question frequently asked by aspiring traders. This chapter attempts to explain that there are no secrets when it comes to exploring the foot print of exchange rates across a chart. Nevertheless price action is more than just swing highs and swing lows. Rest assured this chapter will not leave you in the dark.
It’s easy to brush support and resistance analysis off as not important. Although obvious, this concept is rather abstract and requires some practice to be effectively used. Understanding a concept from a theoretical point of view is not synonymous with having integrated it into the practice. This section breaks down the dynamics of price action, and with the help of lots of charts, you will thoroughly understand this concept and learn how to trade with it. This new knowledge will make you see the charts with a new sense of objectivity and trade in a much more relaxed and proactive manner.
1. Supply and demand - still abstract for you?
The reactions of traders towards the market is what moves the exchange rates. These, in turn, reflect all the information: generally speaking, prices fall when most participants think they are too high and rise when they are considered too low. There is no inherent logic to the market nor a higher intelligence that can be decoded. It is rather the opposite: the market consists of a mass of rational individuals whose reactions are certainly not always driven by rational logic. They are more likely to vacillate between periods of greed and periods of fear. There are so many market participants and so many reasons why each one of them decides to buy or sell at a given moment that no system would be capable of decoding this mass behavior considering all its variables.
Commonly, it is said that chartism, by its very nature, is more an art than a science. This is a correct postulate if we consider that markets are made by human beings and not by analytical methods. All traders, in some way, pay attention to price levels but the way they react to them is never exactly the same.
Becoming a trader requires you to learn how to behave in such an unpredictable environment. It's essential to create a strategic framework with which identify the behavior patterns made by market participants. This knowledge will give the trader a statistical advantage to act upon the market.
To start developing your analytical skills, it is essential to be able to identify supply and demand levels and to measure their strength. One of the advantages of supply and demand levels is their consistency and the fact that they remain visible in a chart for days, weeks, and in some cases for months and years.
Not surprisingly, most trading manuals start by shedding light on this issue as it's one of the pillars of technical analysis. By its logic, it's a simple concept to understand, however, it's also where most inexperienced traders fail. Who has not opened a position and seen how the market immediately turned in the opposite direction to finally liquidate it at the stop loss? To compound the problem: how many times has the market turned to your original direction after the position has been closed for a loss?
The PFX Team invites you to take a step back to economics 101 to make sure you understand the subject:
Supply is the measure of how much of a particular commodity is available at any one time. As the supply of a currency increases, the currency becomes less valuable. Conversely, as the supply of a currency decreases, the currency becomes more valuable.
On the other side of the economic equation, we find demand. Demand is the measure of how much of a particular commodity people want at any one time. Demand for a currency has the opposite effect on the value of a currency than does supply. As the demand for a currency increases, the currency becomes more valuable. Conversely, as the demand for a currency decreases, the currency becomes less valuable.
To illustrate how supply and demand interact to determine an ideal exchange rate in the Forex market, we are going to use a standard supply and demand graph. Supply is represented by a diagonal line that is sloping up from a low point at the left end of the line to a high point at the right end of the line. Demand is represented by a diagonal line that is sloping down from a high point at the left end of the line to a low point at the right end of the line. Finally, the ideal exchange rate is represented by the point where the two diagonal lines intersect.
Next, Sam Seiden recalls what are the basic conditions in a free floating currency market:
The foreign currency (Forex) market is where global exchange rates are derived for everyone including market speculators and end users of currency. People and companies buy and sell currency much like you would buy and sell anything else. Strong economies have strong currencies. When we trade the Forex markets, we are trading economies. Therefore, supply and demand for currency depends on the current and expected perceived health of a country's economy. [...]
Restrictions on capital flows have been removed in most countries, leaving the market forces free to adjust foreign exchange rates according to their perceived values based on pure supply and demand for currency.
In another article, Sam Seiden resumes the main principles which characterize today's financial markets.
The first principle states that "Price movement in any free market is a function of an ongoing supply and demand relationship within that market". The second law states that "Any and all influences on price are reflected in price." Lastly, the third law says that "The origin of motion/change in price is an equation where one of two competing forces (buyers and sellers) becomes zero at a specific price." First, understand that there are always two competing forces at work in the market, buyers and sellers. Our goal is to quantify those forces and identify price levels where the imbalance is greatest as this creates change, or movement in price.
What is a support?
A support level is a price level below the current one, where the demand was stronger than supply, driving the price upwards. Demand is synonymous with bullish, bulls and buying.
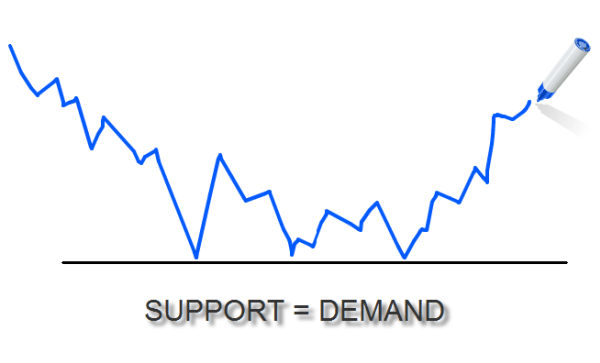
At a support level, general expectation dictates that demand will outstrip supply, so a fall in price would be slowed down by the time price reaches that level. Consequently the price is expected to bounce back upward because support is the price level at which demand is thought to be strong enough to prevent the price from declining further.
The market, understood as the will of millions of investors, considers a price level low enough and acceptable to purchase, so when the price reaches that value, purchases soar. The logic dictates that as the price declines towards support and gets cheaper, buyers become more inclined to buy. As demand increases, prices advance higher.
What is a resistance?
On a chart, a resistance level is an identified maximum level where the supply has exceeded the demand, stopping the upward momentum in the exchange rate, and eventually making it drop from there.
Supply is synonymous with bearish, bears and selling.
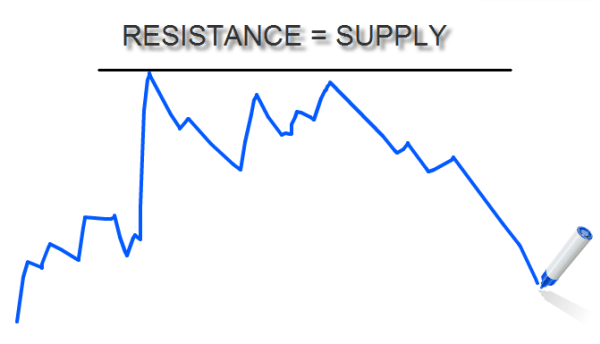
If the market believes that a price level is very high, sales soar at the time price reaches that value.
In other words, a resistance level is a reference price where selling pressure is greater than the demand. In many cases this pressure is so great it can halt the rapid escalation of prices.
The levels of support and resistance are detected primarily by analyzing the evolution of price action on a chart and identifying where prices halted after a rising or falling period.
Resistance thus is the price level at which selling pressure is expected to be strong enough to prevent the price from rising further. The logic dictates that as the price rises towards resistance, sellers become more inclined to sell and buyers become less inclined to buy. When the price reaches the resistance level, it is believed that supply will overcome demand and prevent the price from rising above it.
In this lesson and adjacent video of the Forex Essentials Course, the PFX team shows different chart types by looking at support and resistance levels.
Additionally, James Chen provides us with valuable information about another type of charts, the Point and Figure, to visualize price action:
In short, some may characterize point & figure charting as trading based upon pure price action. This is because only price, which is undeniably the most important aspect of technical analysis, is customarily included on this type of chart (in the form of X's and O's). Other data that can readily be found on bar and candlestick charts, like time and period opens/closes, are generally excluded on point & figure charts. This leaves only the uncluttered purity of price action.
In another blog post James also speaks about a variation of the Japaneese Candlestick charts, the Heikin Ashi:
The distinct look of Heikin Ashi charts is noticeable on the very first glance. During trending periods, virtually uninterrupted series of solid or hollow candles are the rule. This means that even during minor retracements in a strong trend, Heikin Ashi charts will essentially show a one-directional run. Therefore, during these trending periods, Heikin Ashi charts work their best in indicating whether a trend has ended or is still intact.
As you notice, there are different ways to visualize price action. Important for you to know is that all price actions as you see on the charts are derived from market participants buying and selling currencies. Despite the fact there are several ways to capture price action on a chart, we make use of Japanese candlesticks throughout the chapters of the Learning Center.
What happens at support and resistance levels?
If you have read texts on chartism, then you already know the saying: "When a resistance is broken up, we are in an uptrend and resistance becomes support. And vice versa, when support is broken down, we are in a down trend and support becomes resistance.” Despite being true, this theory does not explain what really happens behind the charts.
A simplistic explanation such as: "Who cares how it works? The truth is that it works" or "This works because everyone uses it" should not suffice when seeking to understand the dynamics of supply and demand.
The concept of support and resistance is quite easy to understand, and it has some components which will improve your chart analysis: the relation between supply and demand which exists at any price level can be measured using several procedures as you will learn here. Also the time factor is an important ingredient in the analysis and should be also considered. This Unit and the Practice Chapter A thoroughly deal with both aspects.
Let's start to visualize the potential amount of supply and demand on a chart.
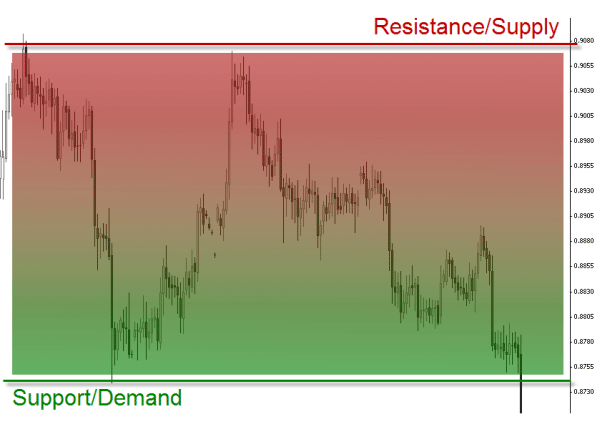
In this EUR/USD 4HR chart you can see how the supply is running out as the price moves away from the resistance area at the initial high of 0.9080, from where it trends downwards. At 0.9080 is where most of the supply is concentrated until it gets exhausted at the low level around 0.8750.
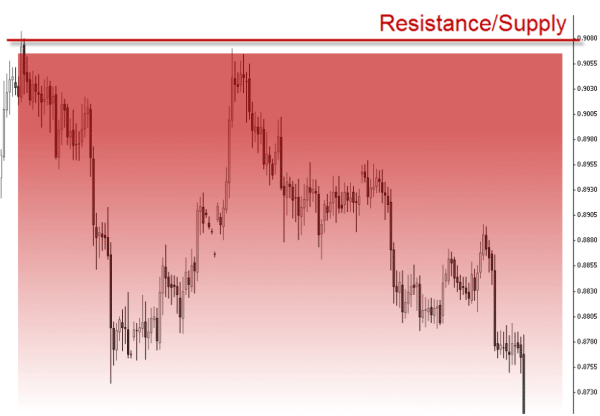
Similarly, we see from the chart below that demand decreases as the price rises after bouncing at the low level of 0.8750, when the demand was at its highest.
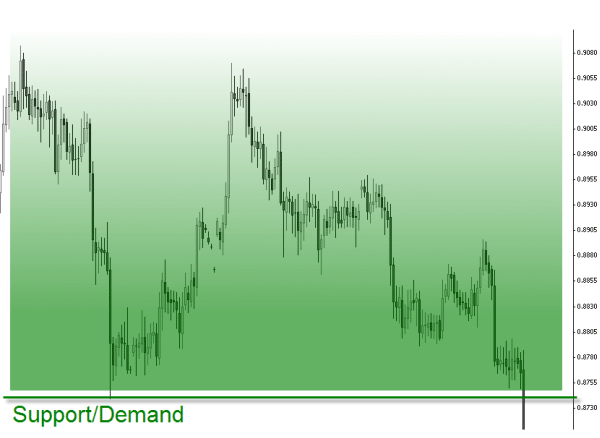
A support level is a price level considered attractive by a large number of buyers. If the demand to buy a given currency is high enough (higher than the willingness to sell), a downward move in the exchange rate will eventually slow down and even reverse. This is what happened around the 0.8750 level: the strength of the buyers was able to stop the pressure from the sellers. Does this happen always? Well, not always but it happens with an astonishing high frequency.
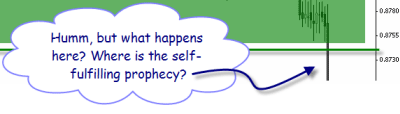
James Chen tells us more about what is usually called a self-fulfilling prophecy:
A quick note about the important role of the "self-fulfilling prophecy" in Forex trading and technical analysis. One of the key reasons that many aspects of technical analysis, especially such important concepts as support and resistance, often seem to work remarkably well has to do with this phenomenon. A self-fulfilling prophecy is a forecast that causes itself to become true. In the case of Forex trading and technical analysis, a certain support/resistance level may be valid and respected to a significant extent simply because that level is well-known, and is therefore watched and acted upon by a critical mass of traders. So, for example, a 38.2% Fibonacci level, an R1 pivot point, and a key uptrend support line do not in themselves really have magical predictive properties. It is more the fact these these levels are so universally accepted and therefore so closely watched and traded by so many traders, that they often take on considerable price action significance. The role of the self-fulfilling prophecy is one of the keys to effective technical analysis in the Forex market as well as all other financial trading markets.
Good observation! We will soon clarify this for you, but don't underestimate James Chen's words because more than often they will provide you with an advantage in the market.
In fact, supply and demand are two forces that coexist in the market at any given time. As shown in the picture below where the two forces are exposed, price action speed slowed down in the middle of the chart and consolidated temporarily at a level where the two forces were fairly equal. When supply and demand are equal, prices move sideways as bulls and bears slug it out for control.
Buyers and sellers create two opposing forces that move prices. Buyers want to buy cheap and then sell more expensive. And sellers, conversely, are always looking to sell expensive to buy cheaper afterwards. So each pip that the exchange rate moves shows the game of power between the two sides: if the exchange rate rises by only one pip, it means that buyers are winning, and a pip down move shows that sellers, for that instant, have imposed their willingness to sell.
A level of support or resistance is a level at which a critical mass of traders (or capital) coincide in their aim to buy or sell a certain currency. These levels are identified by the way traders react to them and because they show a tendency to reoccur. It's not that market participants agree on what to do at a certain price level, they just coincide on their assessment that the exchange rate is too high to buy (resistance) or too low to sell (support).
So it's not even a question of the quantity of traders deciding how to react to a certain level, but the imbalance between buyers and sellers at a certain price level.
The fact that certain price levels have been significant in the past is telling us that they may have sufficient impact on price movements in the future. Sometimes, levels of support and resistance are very clear on the charts and remain intact for a long time. This phenomenon is called the "memory" of the market.
When the price reaches a new low and then rises significantly, both the buyers who bought at that low and the ones who lost the opportunity to buy will be willing to enter long when the price reaches that level again.
Following this dynamic, the phenomenon can be repeated until the balance of buyers and sellers changes. This is what ultimately happens, otherwise price action would take place between two price levels only and the market would be ranging endlessly. But the market is rather complex and many variables can affect price action. The general belief of what was a good price to buy (a support) may weaken until the price finally breaks down.
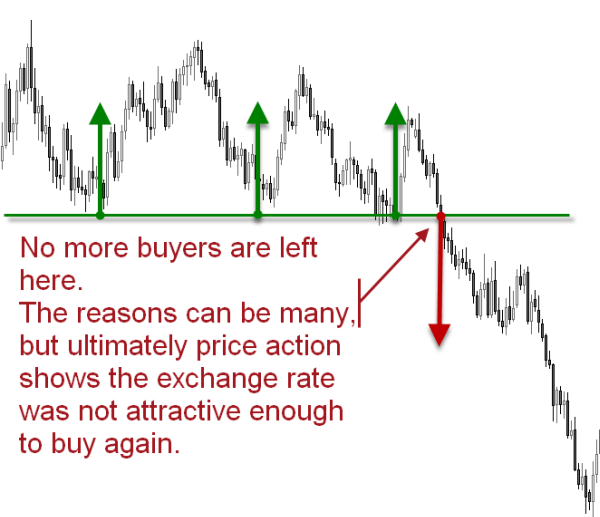
Take a look at the chart below: support did not hold and the break below support signals that no more buyers were willing to buy at that level (green line). So a break below a support level indicates a new willingness to sell as sellers have reduced their expectations and are willing to sell at even lower prices. But equally, the break signals a lack of incentive to buy.
Similarly, a supply level does not hold indefinitely and a break above the resistance level is a sign that supply is exhausted and the demand exceeded it. A break of a resistance is not necessarily indicating a huge demand, it's just that demand is considerably higher than supply, or that supply is inexistent.
Observe the chart below: a break out above resistance proves a new willingness to buy and/or a lack of incentive to sell.
When price breaks a resistance level and reaches new peaks, this means that buyers have increased their expectations and are now willing to buy at higher prices. It also means, and this is equally important, that sellers don't feel coerced to sell at that level and prefer to wait until prices rise above the resistance level.
When a resistance level is broken, we need to identify another resistance at a higher price level. As price approaches that higher level, sellers will be gaining strength again as buyers will tend to stop buying at higher prices. At this stage, pay special attention to the fact that price action is something that always happens between levels of maximum supply and demand. As a trader, you want to train your analytic eye to identify those areas between maximum supply and demand levels, which price can recover when breaking one level to reach the next one.
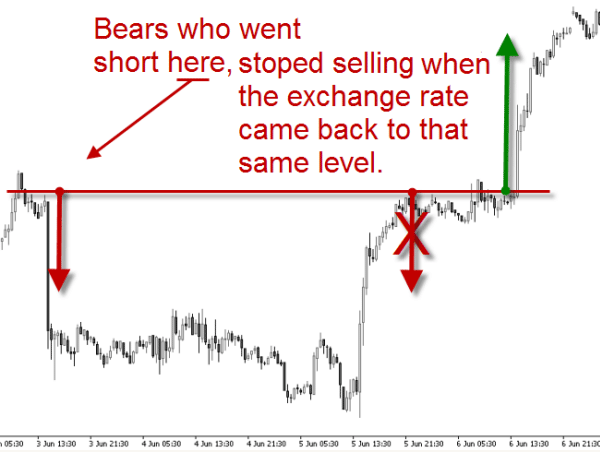
When the supply is exhausted, as shown on the right side of the previous chart, the resistance is broken and the price continues its ascending move. Usually, when a resistance is broken, it becomes a support, should price return to this level again as there is likely to be an increase in demand.
Each moment in the market is unique and many factors and reasons can motivate traders to open and close positions. But one of the factors which may have contributed to accelerate the rapid rise in the price as seen in the chart above is the activation of stop loss orders from short positions. Each stop loss order in a short position is in fact an active buy limit order and can thus accelerate an upward move.
More information about types of orders, can be found in the Chapter 3 of this Unit.
By now you should have at least a basic understanding of how support and resistance works in the markets. It's always important to visualize support and resistance as an imbalance between supply and demand forces where demand creates support when traders show willingness to buy or readjust their expectations and start to buy at higher prices. But a weak demand also contributes to create resistance when traders disagree in buying at higher prices.
On the other hand, supply creates resistance when traders are ready to sell and it also contributes to form support when traders stop to sell lower. This means that support and resistance are not to be seen as a battle between bulls and bears, but rather as an imbalance of two forces. And ultimately price moves stronger precisely when one of the forces ceases to exist. If supply decreases, it will be overwhelmed by forces of demand. The greater this imbalance is, the faster the price will rise.
In an uptrend, for example, demand is not the only cause of the increase. For prices to rise, sellers have to absorb that demand. In the market there is always a counterpart for each position, that is why the two forces are always present, but representing opposite intentions. Remember that the exchange rate you see on your platform is the most recent traded price, a price on which a buyer and a seller agreed to do an exchange.
Sam Seiden simplifies the above theory and explains price action as being characterized by 3 main principles:
Principle 1: Price movement in any free market is a function of an ongoing supply and demand relationship within that market.
[...]
A market is always in one of three states:
First, it can be in a state where demand exceeds supply which means there is competition to buy and that leads to higher prices. What does this look like on a price chart? A "pivot low" is a perfect example.
Second, it can be in a state where supply exceeds demand which means there is competition to sell and this leads to declining prices. What does this look like on a price chart? A "pivot high" is a perfect example.
Third, it can be in a state of equilibrium. At equilibrium, there is no competition to buy or sell because the market is at a price where everyone can buy or sell as much as they want. However, as the market moves away from equilibrium, competition increases which forces price back to equilibrium. In other words, competition eliminates itself by forcing markets back to equilibrium. Even though equilibrium is where the majority of candles are, we don't necessarily want to trade in that area.
[...]
Principle 2: Any and all influences on price are reflected in price.
At any given moment, there is tons of financial information being created and passed on around the planet. This information can be in the form of an earnings report, news, income statement, analyst opinion, economic report, terrorist attack, and so on. All this information creates thoughts and perceptions that are different for everyone depending on their individual BELIEF system. Be careful to notice that most humans assume others' belief systems are the same as their own. This, of course, is simply not true.
[...]
Principle 3: The origin of motion/change in price is an equation where one of two competing forces (buyers and sellers) becomes zero at a specific price.
Let's now put numbers to the simple supply and demand I keep mentioning. Here, we have 300 buyers and 200 sellers at $20.50. Price will remain stable, meaning supply and demand will appear to be in equilibrium until the 200th seller sells. Price will begin to increase or CHANGE when the last seller has sold. It is when the last seller sells that we are left with 100 buyers and no sellers. One of the two competing forces has exhausted itself. In this case, it was the sellers. What appeared to be supply/demand equilibrium was actually disequilibrium or imbalance. It just took a certain amount of time for this unbalanced equation to play out.
In other words, motion (of price) occurs when one of the two competing forces becomes zero. The two competing forces are, again, supply and demand. The time it took for that imbalanced relationship to produce movement is purely a function of the actions of the two competing forces.
The above reasoning explains why markets don't remain stuck between two horizontal extremes when supply and demand interact. If support and resistance held forever, then trading would be easy indeed. We could simply enter and exit as the price seesaws up and down between support and resistance levels. But the fact is that active markets dissipate directional forces because every buyer must eventually sell and every seller must eventually buy in order to cash profits. This induces to price action reversals and the whole process can be seen as a cycle that equalizes trader's action and reactions over time.
As you will see later, a chart may print a strong downtrend on the daily chart, a rally on the 60 minute chart, and sideways congestion on the 5-minute chart, all at the same time. While this cycle process may seem chaotic, it actually reflects the dissipation of the supply and demand polarity.
Derek Frey clearly defines what is a resistance and what is a support from his perspective:
One of the most basic things about trading is support and resistance. Yet many do not fully understand how to find what is a "good" or "true" support or resist level. I will attempt to clear this up once and for all. The chart above is a current daily chart of the Eur/USD on it you can see a red line that i drew to indicate where the strongest level of support is. So how was able to find that? Simply by finding what the last most significant resistance level is. And that is the "secret". Real support was formally a resistance level and real resistance was formally a support level. This works in all markets and time frames but is most relevant on the Daily time frame. The only exception is if it is making an all time new high or low. So if you want to find support look for resistance and if you want to find resistance look for support.