2. Elliott Waves in a Nutshell
Back in 1934, Ralph Nelson Elliott discovered that price action displayed on charts, instead of behaving in a somewhat chaotic manner, had actually an intrinsic narrative attached. Elliot saw the same patterns formed in repetitive cycles. These cycles were reflecting the predominant emotions of investors and traders in upward and downward swings. These movements were divided into what he called "waves".
According to his observations, a trending market moves in a five-three wave pattern, where the first five waves, originally called “cardinal waves” and later on “motive waves”, move in the direction of the larger trend. Following the completion of the five waves in one direction, a larger corrective move takes place in three consecutive waves. Letters are used instead of numbers to track this correction. The three waves forming the “corrective” pattern (labelled a,b and c) are also sometimes called the “threes”.
This is how a five wave motive and corrective phase pattern look like.
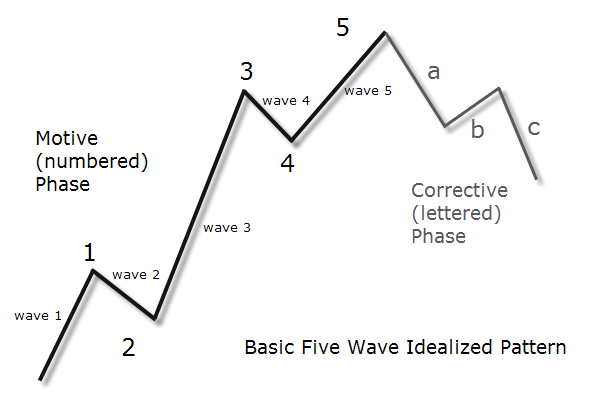
The first, the third and the fifth waves are also called “impulse” waves. Wave 2 is a correction of wave 1, wave 4 is a correction of wave 3, and the entire sequence of wave 1 to 5 is corrected by the a-b-c sequence.
The patterns identified by Elliott occur across multiple time frames. That means that a completed five wave sequence on a small time frame, let's say, a 15 minute chart, may represent just the first wave of a larger sequence unfolding on a 60-minute chart, and so forth. In a macro sense, each unfolding wave pattern is part of a bigger wave pattern unfolded in the higher chart. The sequence from wave 1 to 5 completes one wave of a higher degree, that is, a wave belonging to the next higher tier of wave sequences.
Thus, the movement from wave 1 to 5 completes either a wave 1, 3 or 5 of the higher degree, while the a-b-c sequence completes either a wave 2 or 4 of the higher degree.
When going into lower degrees each wave of the sequence can be broken down into smaller waves accordingly to the same dynamic.
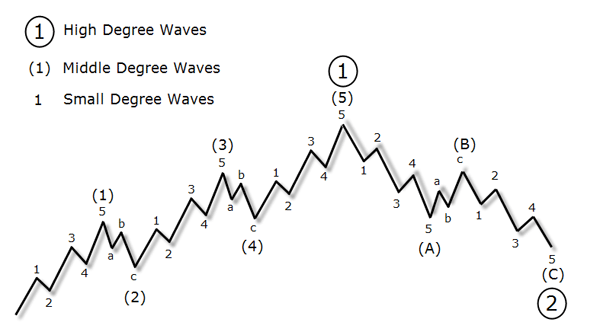
In the diagram above you can see how Wave 1 of the high degree is made up of a smaller 5-wave impulse pattern and Wave 2 is made up of smaller three wave corrective pattern. And each of these waves is, in turn, always comprised of smaller wave patterns, and so forth.
Later in the mid 1970's we would come to know this phenomenon termed as “fractals” in the studies of Benoit Mandelbrot. Elliot was in fact describing the fractal nature of financial markets 50 years before the term was used to describe it. Elliot's theory relies on a very interesting discovery: freely traded markets are not influenced by outside forces but instead are endogenous in their nature. They are in a never ending oscillation between extremes, and that oscillation can be tracked in patterns.
The primary objective to the trader is to identify the presence of the most destructive and thereby profitable wave formations, be they a third wave or a C wave. In case of the Forex market, some authors sustain that many times wave 5 is the longest (see for instance Jamie Saettele, “Sentiment in the Forex Market”, Willey Trading, 2008). We mention the word “destructive”, because the bigger the wave the trader intends to “surf”, the more chances of being wiped out of the position. These waves are often expressed in the extended overbought and oversold conditions of technical oscillators and many retail traders following this isolated signal, fail by trying to go against the trend.
There are some basic rules which help to identify and measure the waves, for instance:
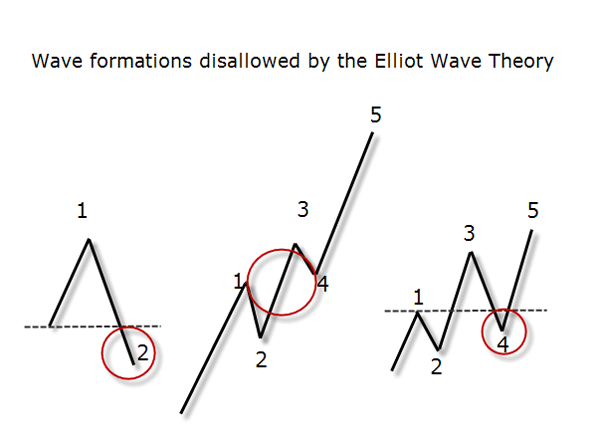
- Wave 2 will not retrace past the starting point of wave 1. In practical terms, this means that in an ascending move, the price after the completion of wave 2 can not be lower then the starting price of wave 1.
- Another rule states that wave 3 is usually- but not always - the longest and never the shortest of the whole sequence, and it always completes beyond the peak of wave 1.
- As another basic rule, the theory also says that wave 4 cannot overlap the end of wave 1. This is the same as to say that wave 4 can never retrace more than 100% of wave 3.
The waves aren’t shaped perfectly when watching real charts and sometimes it's difficult to label waves - it requires a lot of practice. Besides, there are more variations to the basic principles which make the theory a little bit more complex. But the most important point for you now, is to think of the market in terms of waves made of sub-waves. At one hand, this should prepare you to face volatility in a real trading environment, and not expect to ride a trend endlessly in one direction without experimenting any retracement. And on the other hand, it should make you aware of the potential of those retracements and take them as low-risk entry points for your positions.
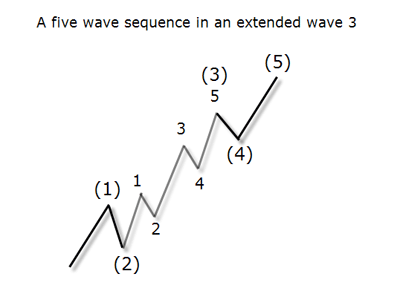
There is one variation of the impulse wave known as “extension”. Extensions are elongated movements in the direction of the main trend which may appear in one of the impulse waves, that is, in waves 1, 3 or 5.
Diagonals are other variations of the impulse waves. This interesting formation is usually a wedge like pattern formed by two converging lines. Diagonals consist of five waves and occur at the end of a strong trend, especially when wave 3 has moved extensively in a short time.
Diagonal waves can also be found in wave c of the correcting sequence, indicating the termination of the movement on a higher degree.
Each one of these five waves consists of three minor waves and not five waves as the usual structure. In a diagonal, wave 4 can overlap wave 1 in contrast to the basic rule. In these patterns, wave 5 tends to overshoot (or undershoot) the border trendline.
In the next section we will cover several types of patterns including wedges.
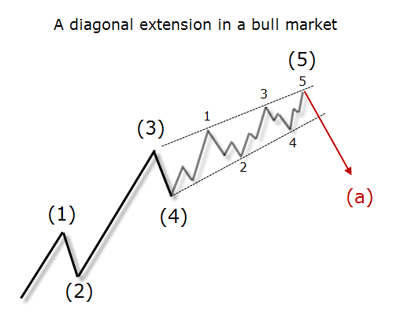
There are also the so called “expanding diagonals” which are very rare. In his book “Sentiment in the Forex Market”, Jamie Saettele explains why these formations are not so frequent:
“ [...] think about why an expanding triangle is rare. Diagonal or not, triangles reflect a balance of bullish and bearish forces that creates a low volatility environment. In contrast, volatility increases in an expanding triangle or diagonal. It is rare indeed for volatility to increase despite a sideways trend (which brings up the point that trend does have three classifications: up, down, and sideways). Chart patterns indicate more about the psychological state of the market than novices originally recognize.”
Source: “Sentiment in the Forex Market” by Jamie Seattele, Willey Trading, 2008.
Expanding triangles are diverging wedge like patterns, in which wave 5 must exceed the end of the preceding wave 3 to be qualified as such.
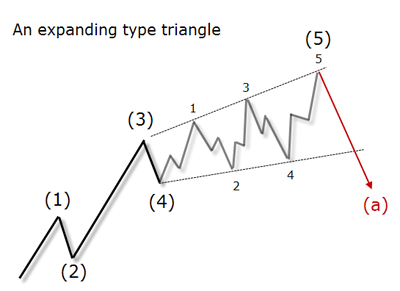
When wave 5 fails - in the picture signaled by (5) - to exceed the peak of wave 3 - in the picture signaled as (3) -, it is called a “failure”. In that case the formation is still considered as a reversal in the dominant trend but it is known in charting theory as a “double top”. This formation will be studied in more detail in the next section.
Variations of the corrective sequence a-b-c have also been studied by Elliot and further researchers of his theory. Its basic forms are know as “zigzags”, “flats, “irregulars and “triangles”. There are other complex corrective forms further subdivided into more categories which don't fall under the scope of this section.
This section is not meant to be a short-cut to your success, but rather an additional approach to understand why the Forex market behaves the way it does, and how it’s possible to trade with such an extreme volatility. In order to survive in this environment it's mandatory to measure profit objectives against expectable losses at any time.
While the Elliot Wave Theory can provide the form and structure of price movements, many analysts combine these principles with the Fibonacci ratios in order to measure the potential of each price move including their probable time duration. The Fibonacci ratios by themselves have less utility to forecast market movements in terms of price and time, but together with a structured approach - like the one provided by the Elliot Wave Theory - they can be a valuable tool. Knowing were you are from a macro perspective gives you the confident panoramic view of what is happening in the market at any time.
Basically, what makes the combination of the waves and Fibonacci ratios so fruitful can be resumed in some basic observations:
- Fibonacci ratios are usually important levels of supply and demand or, which is the same, of support and resistance. The potential impulse or corrective levels (depending on the wave) are usually measured by percentages of the previous wave length. The most common levels are 38%, 50%, 61,8% and 100%.
- The form is always the overriding determinant in Elliot Wave theory, and the Fibonacci ratios help to determine the timing. Those moments with a distance of 13,21,34,55,89 and 144 time periods deserve a special attention (where “time periods” is dependent on the time frame being used). For example, if you find a crucial reversal or an unfolding of a pattern on a daily chart, then expect another crucial unfolding 13, 21, etc. days thereafter.
- Wave 3 in a five-wave sequence is influenced by wave 1 and usually shows a ratio of 1,618 of wave 1. The other two impulse waves are usually of minor length and equal to each other.
- A corrective move that follows an impulse move from a significant low or high usually retraces 50% to 61.8% of the preceding impulse.
- Wave 4 usually corrects as far as 38,2% of wave 3.
- As wave 2 most of the time doesn't overlap the start of wave 1, that is the 100% of it, the start of wave 1 is an ideal level to place stops.
- The target of wave 5 can be calculated by multiplying the length of wave 1 by 3,236 (2 X 1,618).
Sunil Mangawani's lesson on “The 1-2-3 Chart Pattern” is a good resource to add to your trading arsenal once you have approached the concept of waves. Sunil proposes a combination of Fibonacci and waves establishing the basis for a very robust and simple trading approach.
This Is Not What You Think It Is
For the rest of the section, let's take the wave principles and apply what we have learned about the supply and demand equation. You will be astonished to see that price action is not what is seems to be in the first instance.
The most common explanation as to what happens in wave 2 is that market participants who bought at the beginning of the sequence, that is, at the start of wave 1, soon took profits, correcting the price in the opposite direction. Supposing the whole sequence is upwards, people who bought at the start of wave 1 start to take profits, which in turn makes the prices decrease and form wave 2. This wave, by the way, is known to be usually a sharp reversal.
However, as prices go lower towards the starting level, participants consider it again as undervalued and start buying again. This renewed buying pressure, makes prices go higher forming wave 3. So far it's easy to understand.
Now, let's switch perspective and consider the dynamic from the point of view of the participant's emotions. Accordingly to the theory, wave 1 is the first signal that the preceding trend is over and a new trend is starting in the opposite direction. But at this stage most market participants are not aware of the crucial change and when wave 2 starts to unfold, most participants jump in hoping to get something more out of the old trend. This is obviously a trap and can not even be considered the “last wagon of the train”, which in any case would be wave 5. This is an extreme situation both in terms of price and of emotional state of the participants: only charged with lots of optimism someone can decide to enter the market at that late stage.
What happens next is easy to understand: these traders enter the market in the direction of the prevailing trend placing their protective stops behind. Those stops are considered orders in the direction of what will unfold as wave 3. The path to an explosive and extended move is laid out by those stops. Do you see why wave 3 can not exist without wave 2 and why this wave is usually the strongest? Once again, we have a strong movement in price from which only few participants will profit completely - what a crude reality!
Understanding this is dwelling into the fact that the market needs to move in waves. And the sooner you accept to see the market this way, the closer your picture of the market is to a true market trait.
Jim Marten explains a day in the USD Index (June 25, 2008) followed up with the Elliot wave principles. He starts by identifying the major trend and then he searches for a well known pattern to trade the Index. He writes:
“A feeling of dejá vù can give you the “creeps”, making you wonder whether your brain is on the fritz or whether you have actually already lived this moment before. But when you notice a pattern repeating on a foreign exchange price chart, that same sense of déjà vu can be comforting rather than chilling.”
That’s not all you can learn about the Elliott Wave theory but it will help you understand the collective psychology behind exchange rate movements. In this sense, it's a great tool to measure market sentiment along with the tools mentioned in the previous chapter B02. The waves will also help you better understand the chart patterns covered right away in the next section.
It is ingrained in most of our belief systems that we are competing with the rest of the world. In some extreme cases we might even tend to see big market participants or even broker-dealers conspiring against the little traders. Here’s where the wave principles can help change this kind of thinking.
In order to make it as a trader, one of the hardest things to accomplish is probably to acknowledge that what we all really need to do is to get with the flow of what is happening rather than competing with it. The charts are constantly narrating a story. It's up to each of us to determine what story we want to hold on. We can choose the negative side or we can be open to listen the market showing where the next opportunity is.


