3. Example of a Trading System
In this section we will follow the steps outlined in the previous section and build a trading system from scratch.
The system used in this chapter was selected for educational purposes only and it's just one of the myriad of choices available to traders today. Regardless of your skill level, we hope this section will provide you with a better understanding of the process of system development.
The Observation
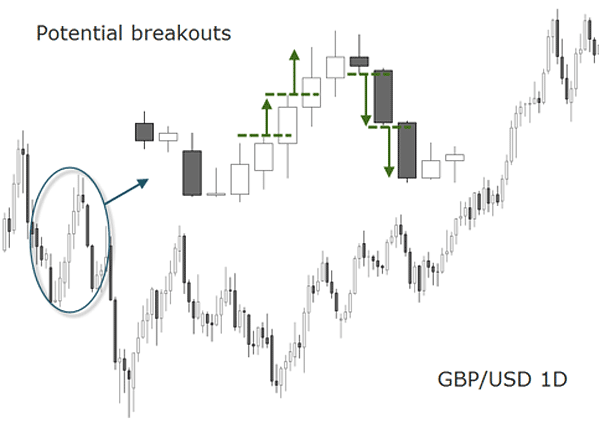
The below daily chart shows that most of the daily candles have different lengths in terms of pips. We also notice that they break the high or low price from the previous daily candle most of the time.
The magnitude of the breakouts differs from candle to candle, but many times the distance the exchange rate shoots off the previous daily extremes is large enough to be considered a profit potential.
The Hypothesis
This strategy aims to capture part of a breakout movement, starting from the high or low level of the previous day.
The market conditions that are to be met in order to capture this event are:
- An increased momentum and volatility in the market.
- A major underlying trend in the direction of the breakout.
Measuring the Hypothesis
In order to measure the potential of the breakout, we will take the GBP/USD pair for its characteristics as a fast moving currency pair, able to break support and resistance levels when it gains in speed and momentum.
Selecting the Time Frame
Although the event of the breakout is visible on the daily charts, we will choose the 1H time frame to start evaluating the strategy with the help of technical indicators.
On one hand, the 4H time interval seems too high to visualize the smaller breakouts, and on the other hand any time frame below 1H may generate unnecessary signals.
The timezone used for testing will be GMT as a standardized timezone for the Forex market.
Developing the Strategy
Following tools will be used to create the conditions and rules of the strategy:
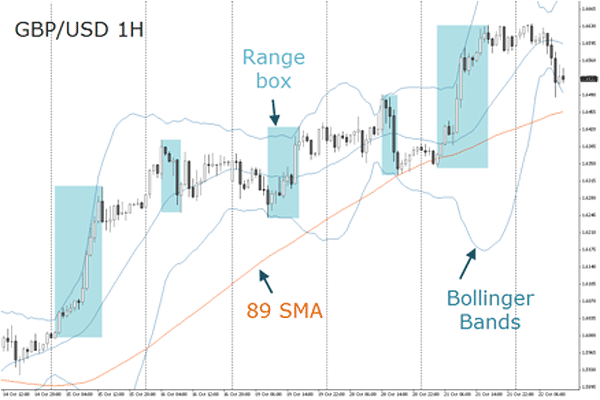
- A price box to mark off the high and the low prices of the previous day will be displayed on the 1H chart, and each 24 hour period will be marked with a vertical line to distinguish the start/end of the day.
- A combination of two moving averages will help to get the direction of the underlying trend. Those will be the 21 and the 89 Simple Moving Averages, two numbers taken from the Fibonacci sequence which are not contiguous (...,8, 13, 21, 34, 55, 89, 144,...).
- Bollinger Bands applied to the 21 SMA will be used as an indicator for volatility. Bollinger bands contain 95% of the closing prices. The higher the standard deviation used in the settings, the more closing prices are contained within the bands. As the breakout movement needs to be aligned with the main trend, we need a parameter that gives some room for price to develop. Therefore the deviation will be initially set to 3.
This indicator will help us avoid trading breakouts if the previous daily range has been very tiny and the market lacks volatility.
Bollinger Bands and RSI is a webinar held by Valeria Bednarik. Here you can extract additional ideas on how to use these indicators.
Entry Rules
In order to start testing the strategy only one trade will be taken per day. Therefore we need to establish the conditions as for the direction of the breakout:
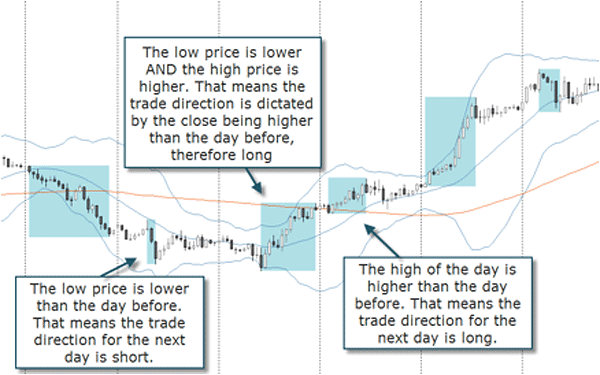
- If the low of any day is lower than the day before, only a break to the downside will be taken the day after. The downward direction will remain unchanged until the high of a day surpasses the high of the day before - from there on, only trades to the upside will be taken.
- If a certain day doesn't break a previous day price extreme, the direction of the breakout remains as it was before.
- If a certain day breaks the previous day high AND low price extremes, the direction of the breakout will be determined by the close of the day. For example, if the close of the day is lower than the day before, the direction is down, and vice versa.
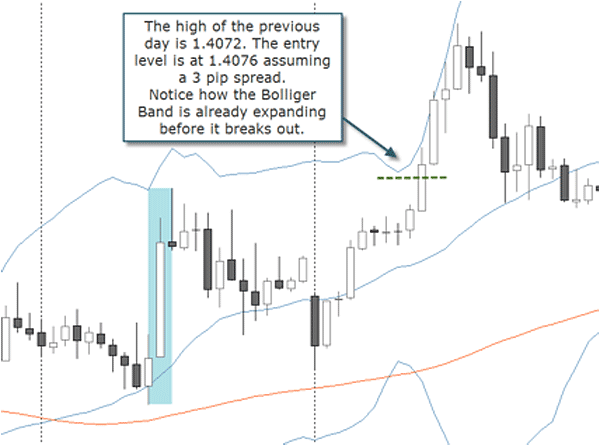
Long entry conditions are:
- The previous day high was higher than the day before (as explained above).
- The 21 SMA is above 89 SMA.
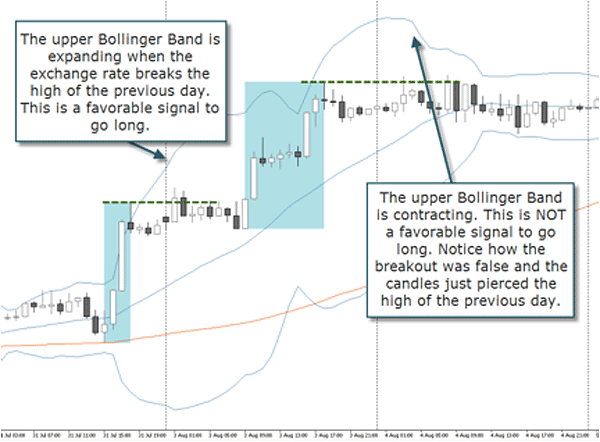
- The upper Bolliger Band is not contracting to the downside in the last candle before the breakout.
Long entry trigger is:
- The exchange rate breaks above the high of the previous day. Adjust the entry level to the previous day high adding one pip and the spread to the upside. For example, if yesterday's high was 1.6350 and your spread for the GBP/USD is 3 pip, than the entry level is 1.6354..
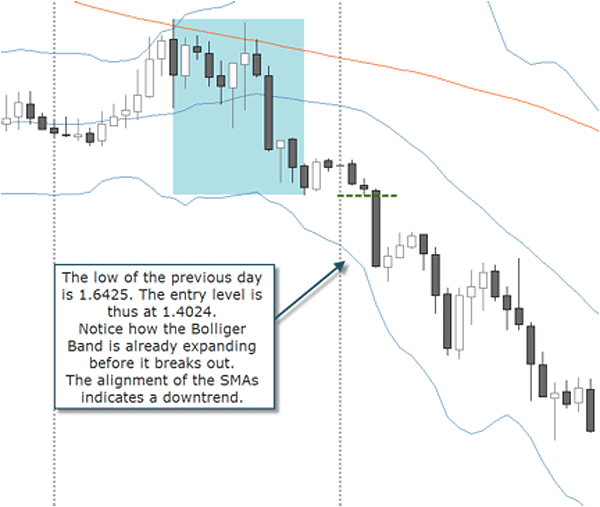
Short entry conditions are:
- The previous day low was lower than the day before (as explained above).
- The 21 SMA is under 89 SMA.
- The lower Bolliger Band is not contracting to the upside in the last candle before the breakout.
Short entry trigger is:
- The exchange rate breaks below the low of the previous day. Adjust the entry level to one pip less than the previous day low to the downside. For example, if yesterday's low was 1.6300, than the entry level is 1.6299.
Exit Rules
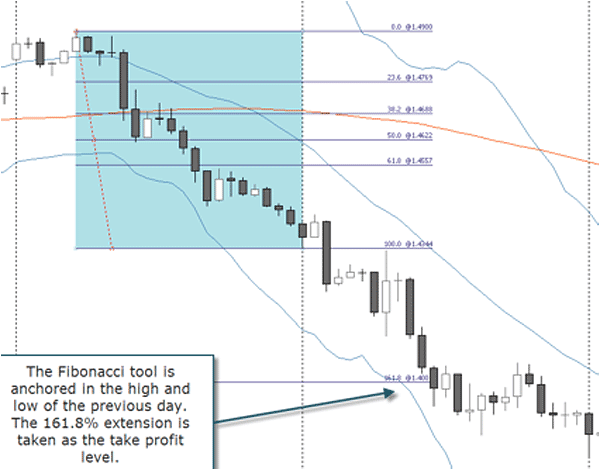
Targets:
There is only one target and this is the Fibonacci extension 161.8%. The exact take profit order will be placed a few pips before the 161.8% level. If there is a round number closer than 10 pips to the 161.8% level, take the round number as a target. Also make sure to add the spread to the target level on short trades. For example, if the 161.8% extension level on a short USD/JPY is 90.00 than the target would be placed at 90.04 if the spread is 4 pips.
Do you want to become a master using the Fibonacci? Learn from the basics to veritable institutional strategies based on this amazing tool. You can watch recordings or read transcripts of live sessions hosted at FXstreet.com about Fibonacci.
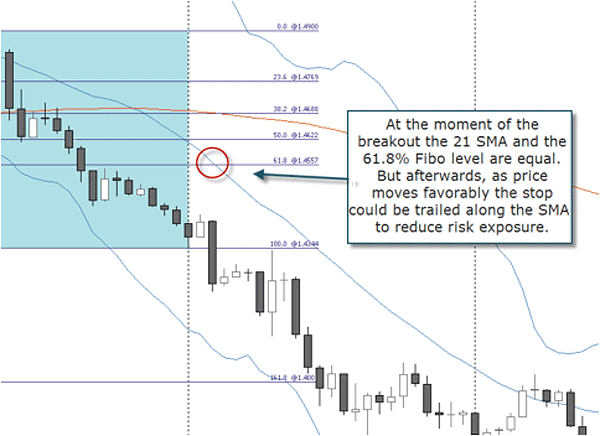
Stops:
The stop loss on a long trade is placed below the 21 SMA or the 68.1% Fibonacci level, which ever is closer to the entry price. Conversely, the stop loss on a short trade is placed above the 21 SMA or the 61.8% Fibonacci level, the one that is closer to the entry price. This way, the worst potential win/loss ratio on every trade is a Phi ratio (61,8 / 38,2 = 1,617801047...).
Position Size and Risk Management
For testing purposes, each position will be entered with one mini-lot and we will limit the risk to 2% of the account balance.
Because of the importance of the subject you deserve an entire chapter dedicated to risk and money management. For now, just concentrate on following the previous steps and follow the rules mechanically. The benefits of this process are numerous as Mark Douglas explains in his book “Trading in the Zone”. Systematically following a set of trading rules will help the student in the following ways:
- Build the self-trust necessary to operate in a unlimited environment.
- Learn to flawlessly execute a trading system.
- Train your mind to think in probabilities.
- Create a strong belief in your consistency as a trader.”
Source: “Trading In The Zone” by Mark Douglas, Prentice Hall Press, 2001, p.172
The personal growth a trader experiences through this exercise alone justifies developing a mechanical trading approach.
You may start with this system as a guide to develop a different one, you may even start by copying this system, but with time, your goal will be to develop your own unique trading approach: a system that serves as a logical frame work for any trading decision you make.


