2.Trend Following Starters
Momentum Box Trade
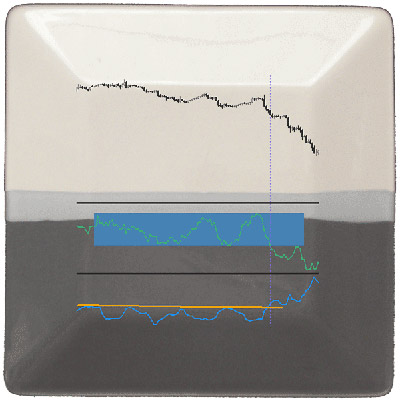
The momentum box trade is a breakout type of set-up, using the Momentum and Average True Range indicators as proxies to volume indicators. Its premise says that once price consolidates it will not rest forever within the range - it has to break out sooner or later. The box is a visual representation of the price range, taking the recent high and low prices as its upper and bottom boundaries. Another box is drawn on the momentum indicator too, using its peaks.
Chris Capre's refined way to measure the breakout force involves comparing the indicators value of the candle prior to the breakout with those of the breakout candle. The comparison, made in terms of percentages, offers a very objective view of the quality of any breakout move.
The momentum indicator is set to 12 periods and ATR is set to the standard of 14 periods. The below EUR/USD 1H chart of November 20, 2009 illustrates that through an example:
Chris Capre begins the webinar titled Learning to Read Price Action by introducing his approach to price action, mentioning concepts like impulse and corrective moves you surely remember from the Elliott Wave Theory. He then proceeds to teach several personal tricks he uses to measure price action.
Another small nuance you get to understand with Chris is the effectiveness of measuring the candlewick length in terms of percentage in relation to the total candle length or consolidation range. This information redirects your attention to small candles that usually pass unnoticed. If a small candlestick's wick is 80% of the candle's range, it may be a very powerful indication as to whether the supply/demand equation is leaning towards.
Pullbacks with Candlesticks and Western Technical Analysis
The particularity of combining Eastern and Western technical analysis is that it provides a better understanding of how important confluences are.
The concept of confluences is about multiple technical confirmations: when coinciding, technical indicators collectively reinforce each other. Any combination of two or more technical factors is always stronger than a single signal specially when two or more of them point in the same direction.
One important note to this topic is that the use of multiple indicators should not lead the trader to the many times mentioned peril of “paralysis by analysis”. If you detect a Hammer candlestick pattern on a strong demand area, let both indications reinforce and confirm each other. If, consecutively, there is a confirming signal from a technical indicator the win probability is definitely on your side. Here is an example of such a set-up, served right to your table:
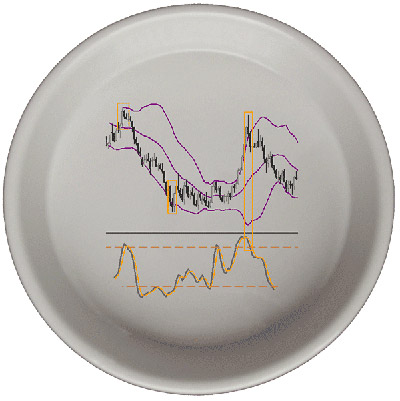
The Western technical factors that, combined with Japanese candlesticks, provide the best signals are, accordingly to James Chen:
- Support and resistance levels
- Dynamic trendlines
- Fibonacci levels
- Pivot Points
- Chart formations (Double tops and bottoms, etc.)
- Bollinger Bands
- Oscillators
Waiting for a proper confluence to develop on whichever time frame you are accustomed to requires patience. But once all factors are aligned prices usually react to it impulsively providing very fast profit potentials. This phenomena happens all the time and it works, as mentioned in Chapter B01, as a self-fulfilling prophecy.
James Chen has thrown light into this subject in his webinar Combining Candlesticks with Western Technical Analysis. In this recording several daily charts are scanned with the help of support and resistance identifiers such as Moving Averages, chart formations, Fib levels, Pivot Points, Bollinger Bands and Oscillators. A special attention is put on long candlestick shadows as they warn us of potential turns of the market.
Fibonacci based Moving Averages
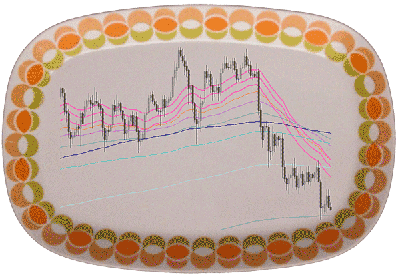
Raghee Horner simply calls them “the Wave”, the three 34 period Exponential Moving Averages: one on the high, one on the low, and one on the close prices. Why “34”? It's a Fibonacci number, of course. Hers is a very visual trading approach, and the three-wave element is the center of her analysis and the way she chooses the correct strategy for each type of market. Depending on the disposition of the wave lines she interprets the market as being in one of the 4 cycles: “mark up”, “mark down”, “accumulation”, and “distribution”. The psychological characteristics of each cycle are “greed”, “fear”, “boredom”, and “confusion”, respectively. And there is a set-up for each one of these market moods: trending following; trend reversal; momentum; or rangebound set-ups. This is done by interpreting the angle formed by the three EMAs relative to the price/time axis, in the way Charles Dow did.
The Waves are just a part of the Lasy Days Lines, a compendium of Fibonacci related Exponential Moving Averages (55, 89, 144, 233, 377, 610, 987, 1597) and the 200 Simple Moving Average. Raghee came to these lines when researching for a dynamic support and resistance tool that could indicate where the market is likely to find ceilings and floors, and also indicate the underlying market cycle. Put them on a chart and see for yourself how often price respects these levels and you will understand how powerful they can be.
Raghee explains that unless you take the time to do that across multiple pairs and multiple time frames you are not going to ever prove to yourself – to your eyes - the clarity of support and resistance they do provide. Another interesting statement she makes is that you have to absorb price action in order create that confidence to use a new tool. This statement inspired us to instill the price action basics early on in Chapter A04.
Psychological price levels formed at round numbers are also a key aspect of Raghee's trading and she will pay even more attention to such a level if one of the Lazy Lines is confluent with it. If you don't know what a technical confluence is, just check our previous “starter”.
Live Trading Set Ups with Chart Patterns and Market Cycles, by Raghee Horner.
Human Perception Gaps
How we succeed as traders depends on our ability to understand how human emotions will affect price action and know how we can take advantage of these opportunities. Electronic traders have to learn to detect them on the charts because they are not able to witness the emotional state of the other market participants like a floor trader would be able to do.
Mike Baghdady explains the workings of price action in a very illustrative fashion using terminology of the floor traders. You almost can hear them screaming out loud “Buy! Buy!” when price is at a momentum high. At levels of strong momentum, where a floor trader would witness the enthusiasm of the other players, it is where a bias usually occurs.
Directional bias turns when the majority of the participants has to make a trading decision. We know that each type of market participant, whether hedger or speculative trader, has a different conception of risk. Traders define their risk partly by using a stop, either by fixed money stops, technical stops, or time stops (see Chapter C03). The identification of risk, by understanding the nature of price action, is what gives us clues about those decision points.
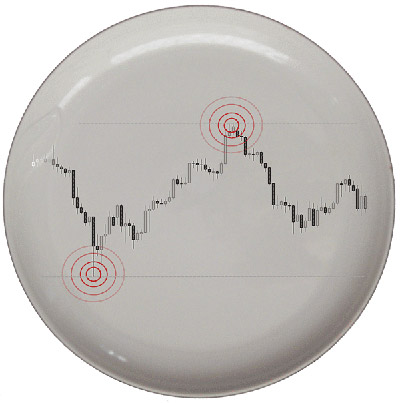
These points are strategical stop or exit placements and signify a tremendous advantage, because they represent the highest imbalances of buyers and sellers, those moments when everyone on the floor was screaming “Buy!Buy!” and no one was selling. The astute trader identifies these price levels as levels where market participants make poor decisions, where they get caught in risky situations and where they have to pay to get out of them. All these human emotions manifest themselves in price movements and are therefore considered a source of opportunity for the successful trader. Human emotions and irrational thinking is what creates the repetitive pattern which can be identified.
The structure of the chart is given by those points where price reversed strongly: momentum highs and lows, as Mike calls them. When the price breaks out of an “acceptance zone” (a price range) through support or resistance, trend followers gain an edge because of a gap in human perception at the time of the breakout. This gives way to momentum, but the point here is that although momentum is what confirms the trend, it always precedes price.
A loss of momentum, on the other side, is not a sign of trend reversal, it is merely a pause. The loss of momentum happens because buyers and sellers agree to the new established price range (“new equilibrium” or “new price acceptance zone”). They will continue to buy and sell within the range which is known as “backing and filling”, thus forming some of the known chart patterns like triangles, flags, or complex corrective waves (in Elliott terminology). The breakout in between equilibrium zones is what offers the traders the biggest profit potential.
At the momentum lows, if sellers are no longer willing to sell at the current price and they are demanding a higher price, and at the same time the buyers are willing to pay a higher price, prices will then move up. The inverse situation happens to the downside. The important point here, and this is one of the keys to understand Mike's argumentation, is that collective perception of prices will inevitably take a life of its own, an aspect deeply studied in Behavioral Finance (see Chapter B02).
How to manage risk using Price Behaviour analysis, by Mike Baghdady, is a webinar held after a series of four webinars dedicated to price action, where he introduces the listener to a new approach of price action - that of the electronic markets where trading computers scan the market in search for opportunities and liquidity at the speed of nanoseconds.
You may be wondering what about those false breakouts and how you can see that a momentum high or low is a good level to stop and reverse. Accordingly to Mike Baghdady, price action will tell you the answer because if that level is a significant momentum high or low, then above and below there will be many clustered stops. What happens if these stops are hit? You got it: capitulation. And this happens in the form of a strong directional movement. That is all the evidence you need, says Mike. To protect the new position, the new stop goes past the old entry level and beyond the momentum high or low.
There is nothing like seeing it live, so we encourage you to take time to see Mike's recorded webinars.