3.Trading Sensations
The Sunday Open Gap
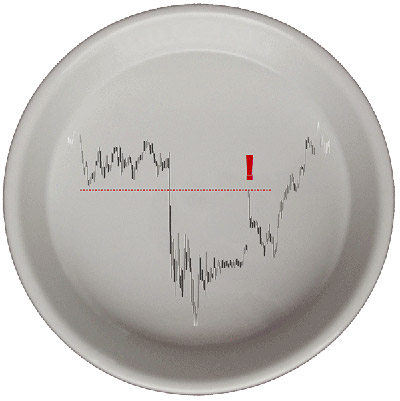
Small gaps happen all the time in the Forex market, but the ones Sam Seiden capitalizes on are the bigger ones that mostly happen on the Sunday open. Some of them can be identified as “novice gaps”.
What is a novice gap? It is, for example, a gap up in price in the context of an uptrend into an area of supply (resistance). Think for a moment who is buying above the gap when price has already been shooting up for a while? Such a trading decision can only come from a novice trader. And who is sitting at the opening of the novice gap? The smart money, that is, the more experience traders. This is the reason why gaps most always get filled. If you understand the origin of the gap, as being the maximum expression of the demand/supply imbalance, you also understand why they most always get filled.
In order to capitalize on it you have to trade against the novice traders move: if they bought into a supply area, your are going to sell because that gap is probably going to get filled by those sell orders clustered at the resistance area. Conversely, if the novice sold at a demand level when price gaped to the downside, you can profit from the move when the gap gets filled to the upside.

A professional gap, in turn, is one that happens to the upside in the context of a downtrend, or to the downside in the context of an uptrend. This is what allows astute traders to sell rallies and buy dips in the market. While in the novice gap we want to fade the gap, when facing a professional gap we want to join the gap. You do it by entering in the direction of the main trend when the exchange rate penetrates the gap.
To learn more about gaps visit Chapter A04 and Practice Chapter A to find plenty of examples to practice on.
There are different types of gaps in markets, that's why learning how to identify and handle them can be a key component in your trading. Why not specialize in trading just the Sunday opens in the Forex markets? Sam Seiden introduces you to the subject in the webinar Professional Gaps vs Novice Gaps in the Forex Markets.
Tracking The Institutional Order Flow
With volume and order flow unavailable in the FX market, the next closest relative indicator is price action which has the fingerprints of order flow. Chris Capre addresses several models to read price action and determine where the institutional money is pushing the market. Since retail traders can't move the exchange rates, they have to emulate the big traders. Independently from their originality or creativity in trading, successful retail traders are essentially good imitators.
With that being the case, one of the models Chris proposes is the identification of impulse moves. A characteristic of impulse moves it that it covers more pips in less time than corrective moves. Impulse moves are also characterized by having larger candles in whatever time period we look at. To identify in which direction the larger candles are pointing is not always evident, but they are usually faster and more violent than corrective ones.
A second particularity of impulse moves is the emergence of several equal colored candles, that is, several bullish or bearish candles in a row.
Most of the time, impulse moves are followed by corrective moves and this sequencing is a characteristic of price action. In terms of Elliott Wave Theory, a corrective move is not necessarily a retracement. This is an important aspect to consider, and taking it into account can protect you from entering counter trend moves too soon. The techniques developed by Chris Capre can contribute to more objective reading of the market waves.
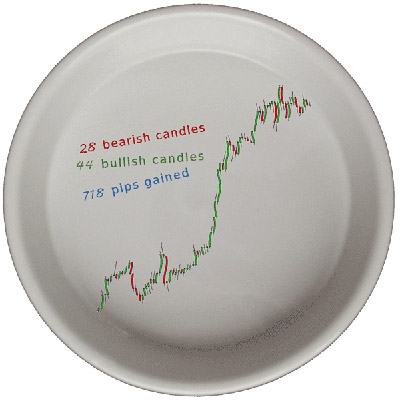
A corrective move is characterized by a more even distribution of bull and bear candles and also by the emergence of more wicks on the candle's extremes. In a corrective move, there is no clear difference between the amount of pips gained versus the amount of pips lost. This is Chris' second model of price action and order flow measuring.
Counting red and green candles for a certain period of time and measure how many pips the market went up and how many pips it went down gives you an idea of who was making money and who was not. In other words, it tells you where the institution order books were lining up. Remember: you want to emulate the ones who are making money, not going against them. Although this is something obvious when looking at a chart, without counting you don't have any measure of what was the comparative ratio of wins and losses. Sometimes you get a ratio close to 1:1 pointing to an equal number of bullish and bearish candles. Does it mean a lack of impulse moves? Not if the size of the bull candles has been 30% larger than the bear candles, for example. This gives you a quantitative measure of what you can expect to profit from a certain market.

In the webinar Learning to Read Price Action, by Chris Capre, you can not only learn the above measures but also the amazing way he structures chart formations with the time variable. This is a concept not seen elsewhere in the Learning Center and you should definitely have it on your arsenal if you trade with chart patterns.
Another measurement model taught by Chris is the information given by the close price of a candlestick relative to the recent price range - which candles are closing towards the high or low within a consolidation range. If they close towards the lows of the range, that tells us there is no profit taking happening, which also means the order flow is staying involved in that particular candle and is being carried into the next candle. Otherwise there there would be wicks forming, and if that happens you want to assess the nature of the wicks too: how big they are and if they are consistent at a particular price level.
The “When” Is More Important Than The “What”
Derek Frey brings up the fact that there is a difference between “created indicators” and “discovered indicators”. The Gartley pattern is precisely a discovered one. There are some indicators used in the financial community which were not created to do price chart analysis, but rather discovered in the process of empirical research in other areas. As they are usually manifestations of natural conditions, they can be used very well to analyze markets since markets are complex organic systems. Markets are an extension of nature because it's an expression of human activity. People, as a group, are very predictive because they do the same things over and over again.
Derek alerts on the misunderstanding of the trading axiom “buy low and sell high”- which is, in fact, the very nature of retracements and range trading. Many people are doing just the opposite by buying when price has already moved up, which is usually called “trend following” but in reality it is just “buying high”.
The set-up herewith portrayed offers an accuracy of 70% reported by many people who use them. Besides Derek Frey, several of our contributors have reached the same results in their research and trading. Derek, for instance, has tested it on wheat price data going back 500 years, and this is the accuracy it proved to have! We recommend you to watch the webinar Market harmonics and Forex Trading by Derek Frey.
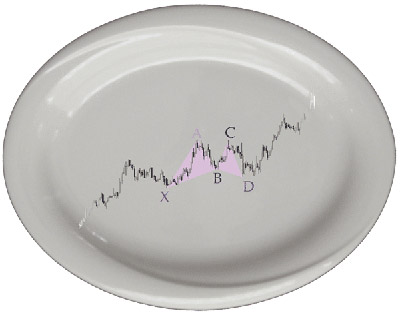
The most critical aspect of the Gartley is the B point retracement, which must be at a 0,618 ratio of the X-A leg. The B is the center (the heart) of the pattern. The Gartley pattern we know today is a more robust modification of the original one discovered in 1935, and the pattern is said to be still in progress. It was in the 90's when Larry Pesavento combined it with the Fibonacci ratios. The Gartley is a classic retracement pattern which offers a logical place to put a stop loss as well.
Also in the Gartley you can measure time by counting the candles. See how the distance between A-B and C-D is roughly the same in terms of price and time in most of the cases. An even better pattern structure is when the relation of time between those two legs conforms to a Fibonacci scale. In general, there should be more structure on the time side of the equation, not just on the price side. The entry is then at point D and the stop goes behind the X point. Targets can be the several Fibonacci retracements and the 161.8 extension of the C-D leg. These are the classic Gartley targets:
- 1st target is the 38,2% of the A-D leg
- 2nd target is the 61,8 % of the A-D leg
- 3rd target is the 1,618 extension of the A-D
Note the probability of hitting the first target is higher than hitting the second. By the same token, the third is the less probable target to be hit. For this reason, the G point is very good to trade by fragmenting your position and making use of trailing stops.
The advantage of the Gartley over the conventional 1-2-3 pattern is that you have a lot more rules which structure the pattern. Those rules serve to guide you in protecting the stop, fine-tuning the entry and timing the entry.

In this other webinar with Derek Frey, My Favorite Patterns To Trade, you get to know the complete rules of the Gartley pattern, a small experiment to illustrate the magic of the Fibonacci proportions and strategical rules to trade the Gartley pattern.
Top Down Assessment
Adam Rosen points out an often forgotten aspect in considering the time of the year and time of the day as a fist step to gauge market conditions. Secondly he lays out a specific method to scan the market in order to identify if a pair is trending or ranging.
What he shows in the below linked webinar is a simple process we may employ to look for short-term trade set-ups. When the market is caught in a range, usually traders start to expect a breakout. The problem is when the market keeps trading within the same boundaries and doesn't break out.
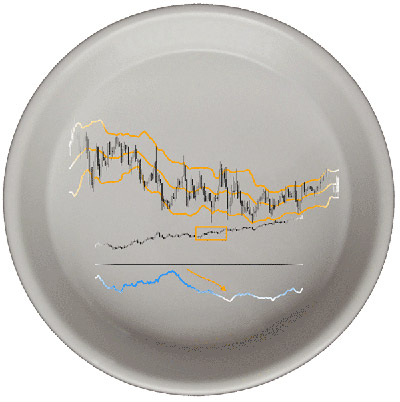
Just to be doubly sure, Adam Rosen uses the Average True Range indicator and searches for trends within the indicator. A downward sloping ATR is indicative of a market printing shorter candlesticks, which in turn is indicative of a corrective move or rangebound situation. He then addresses a specific set-up for this type of market after looking what pairs have the highest and lowest ATRs and are thus more likely to change from a ranging to a trending condition and vice-versa.
A declining ATR is also indicative of a declining volatility, meaning that you can capitalize on volatility explosions using the ATR, although it is a quite lagging indicator for volatility. Nonetheless, there is more potential for price breakouts with an increasing ATR than with a decreasing one. Doing this analysis on the daily time frame will help you to find out what currency pair is a candidate for intraday breakouts. The analysis is done in a top down fashion starting in daily charts until landing on the 5M chart for execution.

When the ATR is not giving a clear picture of the market's conditions, there is a clever way around this: draw trendlines on the indicator the same way you would do it on a price chart, using swing lows and swing highs as the contact points of the lines. When the ATR breaks out a line, the market has changed conditions and may be in a trending mode again.
As for ranging conditions, when the ATR is declining and the chart shows price action clearly boxed within a range, you plug the Bollinger Bands and wait for price to break the upper band and close back below, and in a reverse situation, wait for a close above the lower band if price has just crossed it to the outside.
- Sell side
- Buy side
- Both as the Forex is a bi-directional market.


