5.Counter Trend Desserts
What is visible in the market must be true?!
Novice traders are often gripped by panic when the market moves against them and try to cut losses at extreme levels. When the market moves in their favor they also fail to book profit out of greed despite their good understanding of charts. As long as traders continue to act emotionally, market operators know well how to exploit their herd mentality in a systematic manner.
Risk aversion will alternate with risk appetite during the day and from session to session. If there is risk appetite from the part of the retail traders, then market makers will try to move the market in the opposite direction forcing traders to liquidate those long orders. Once liquidated, the market makers can easily move upwards with their orders filled at better prices.
As Dr. Sivaraman explains in one of his webinars:
“When the market rises one needs to understand why it is rising, the big players quickly rise to market to sell and book profit in their positions. Similarly they quickly drop the market to buy against their selling. Hence trading along with the big players may appear that one is trading against the market, but if there is a good understanding of the types of market moves the big players make, one can easily understand operators' intentions and trade at ease to make consistent profit.”
Dr. S. Sivaranan recommends to watch the market 30 minutes from the start of the session. If players drop the market below a recent low and the price doesn't stay there for more than 30 minutes, it means they were trying to find better levels to enter long positions. Once broken you keep watching the market: if this level is now tested again, then you enter in the direction of the trade.
The breaking of recent lows and highs is a signal of opposite orders being filled at a better price. Depending on the time the rate spends beyond a broken level it will tell you what the intentions of the market players are.
Usually, if the net change in price for the session is negative, market makers will try to make contrarian moves to get their orders filled at the best average price. This is when you should enter short positions. Conversely, if the net change for the session is positive, market makers will do contrarian downward moves to find those sell orders at lower levels whom they can buy from at a good average price.
The rules for this set-up are the following: take a sell position if a pair is near the high and doesn't break the high during thirty minutes of watching, or enter long if a pair is near the low during the same time. Keep a 30 pips stop loss or hedge the order (with an entry stop) to limit the risk. Once the position makes more than 20-30 pips profit, move the stop to break-even and remove the hedging order.
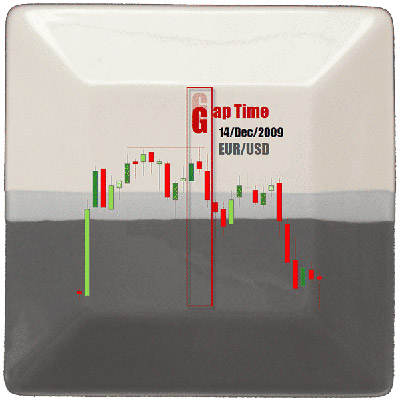
The gap time moves are “false” moves opposite to next session's moves. These are the sessions and its gap times:

- Japanese session 00:30 – 07:30 GMT
- Gap Time 07:30 – 08:00 GMT
- European Session 08:00 – 13:00 (08:00 – 14:00 daylight savings time)
- Gap Time 13:00 – 13:30 GMT (14:00 – 14:30 GMT)
- US Session 13:30 – 20:30 GMT (14:30 – 21:30 GMT)
- Gap Time 20:30 – 00:30 GMT (21:30 – 00:30 GMT)
The hedging set-up herewith mentioned is in fact a stop limit used as a measure to avoid nominal losses and not really an hedge. If your original position is in negative more than 30 pips, the hedge order, which refers to taking the opposite position in the same pair without offsetting the original position, will be triggered. Once the hedge order is in profit, you can move the stop to breakeven or close the order at a profit. Then turn back to your first position and try to reduce the risk by closing it at a small loss, break-even or even at a profit.
In case your original position is in profit, you can remove the hedging order and move the stop to the entry position. From here on try to trail the stop depending on the momentum of the market. Use the distance between the recent high and low to measure your take profit. For example, if the distance is 45 pips, then aim to get 45 pips profit, if it is 75, take profit at 75 pips. Profits are booked within the same session.
In one of the Tracking the forex market together webinars given by Dr. S. Sivaraman, you will learn the core idea that you should never chase the market: buying during a quick rise or selling during a quick fall is a mistake. There are movements in price designed to trap the traders before market reversals.
Spotting the Novice Trader
Using conventional technical indicators with a deep knowledge of what happens behind the charts is what Sam Seiden teaches throughout his webinars. He doesn't focus so much on news or on interest rates, but rather in taking the other side of the novice traders' positions, those who usually lose.
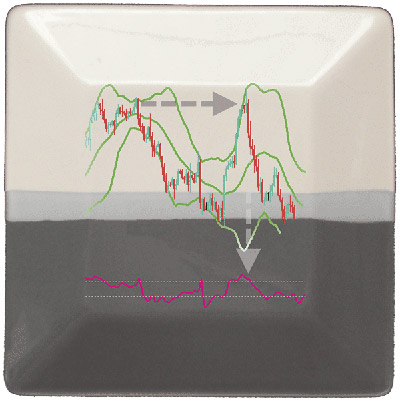
The set-up we picked from Sam consists of a combination of his stellar teachings on the the market's supply and demand equation with technical indicators. It basically consists in selling when a break of the upper Bollinger Band is inside a strong supply area and viceversa. As a target you can set the opposite band or look at the left of the chart and find your nearest opposing support and resistance level. Entering positions simply buying when price pierces the lower band and selling when price pierces the upper band is simply not enough. It's by identifying the intersection with key support and resistance levels that you put the indicator to use. As you see, a lot of our contributors use the concept of intersection.
For a second confirmation Sam suggests the use of the CCI and its overbought and oversold signals. See the below illustration for an example:

When tracing the support and resistance area, put those recent candles (including their bodies) inside the zone because that is the zone where the recent selling or buying took place, and we want to place our order in the meat of that zone.
Then you wait for someone to make the mistake of buying into a supply area, with prices crossing the upper band and CCI overbought. Conversely, you wait to buy when prices enter a demand (support) zone with prices piercing the lower Bollinger Band and CCI oversold, because at that moment we are buying from someone who is committing a strategical mistake accordingly to the laws of supply and demand: he or she is selling at a demand level. We just want to take the other side of the novice's trade - a low risk, high reward, and high probability trade.
Build a whole new picture of price charts learning how to find the low risk, high reward, and high probability trade with Sam Seiden in the webinar Rule Based Short Term Trading In Forex.
Build A Running Picture Of The COT
A running picture both of the open interest and the size of the positions in the different pairs is Joseph Trevisani's picked set-up.
If it is axiomatic that the first position that begins a trend possesses the most potential profit, it is equally true that no trend continues forever. Taken together these statements might be the mindset of the contrarian trader.
Contrarians base their indicators in the psychology and behavior of crowds.
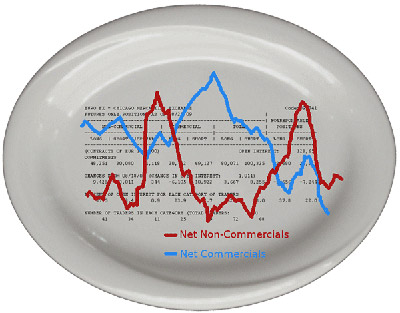
The classic contrarian indicator is the Commitment of Traders’ report published by the Chicago Mercantile Exchange that lists open positions of hedgers and speculators (refer to Chapter B02 for more information on the COT).
The drawback of the COT report, and in fact of contrarian ideas in general, is that it is a sentiment indicator, it provides a timing or specific buy and sell signals. When a market has been moving in one direction for considerable time, logic dictates there is a great degree of contrarian sentiment. Many traders will retain initial positions rather than take profit and reopen a new position within a trend. These older positions are a drag on trend continuation.
In practical application, contrarian indicators are an alert - or an early warning sign - of a potential shift in sentiment. Because they represent the psychology of the market they can presage great energy. When the overall psychology of a trend shifts, it often does it rapidly and with great volatility. The desire to secure profits can overwhelm a market, undoing 50 percent of a trend in a few days.
For the contrarian trader the most reliable indicator of a coming change in direction is the universal opinion that the current trend will continue. Markets are a widely observed phenomenon, and as recognition of the market direction spreads and more and more traders join the move, each pull back or correction becomes the opportunity for more profit seekers to join the trend. At some point market participants are satiated; there is no new influence to bear. If everyone whose analysis or intuition dictated a long position has taken his position then who is left to drive the market higher? The accumulated positions that make up a trend are all united by the simple desire to profit from those positions. That motive, more than any other, puts powerful internal limits on any move. The longer a trend has lasted the greater is the number and the weight of the accumulated positions, and the greater the desire of market participants to realize some of their acquired profits.
The higher the commitment (COT), the greater the strength of the contrary signal. If a market registers, for instance, the highest open long Euro interest on record and then the following week had the second highest, clearly this indicates a market ready to take profits. But the question remains, when is it the best moment to pull the trigger?
Sentiment indicators are weak on specifics, they do not provide price levels or timings, they are not technical in the sense that we can perform our analysis and commit to a trade based on that information.
For this reason, in a webinar called “The Contrarian”, Joseph Trevisani goes on explaining that:
"Any reasonable use of the COT report must be combined with technical analysis. The COT promises or hints at volatility. But more traditional analysis will provide the clues as to where the psychology will activate. A high COT number is generally a warning of a potential profit taking stops building opposite the trend.
Any currency move is portrayed in the COT report in that the IMM traders always have speculative positions, it is the relative size of the positions that indicates the ripeness of the trend for profit taking or potential reversal."
The Contrarian, by Joseph Trevisani
The idea and set-up disclosed in the above webinar, is that the market clearly has to take profit on a long uptrend in order to move higher. In other words, it must correct before the next impulse develops. And as we know, any profit taken on a long trend will bring the exchange rate lower. The profit taking motive is but paramount: the trader wants to know why the market view has changed.
Besides, remember that if the actual volume is small then the COT's value is diminished, as it could represent only the position of a relatively few number of traders. It is the relative volume that tells you the intensity of the move, therefore the open interest needs to represent the largest number of traders possible. You don't want the number to represent the positions of a few large traders only. The best method is to read the report weekly, only so it will provide a running picture both of the open interest and the size of the positions in the different pairs.

The Equilibrium Point
The concept of fair market value is visible in retracement movements or when market loses momentum and waits for a large moving average to come close in order to rest on it for a while.
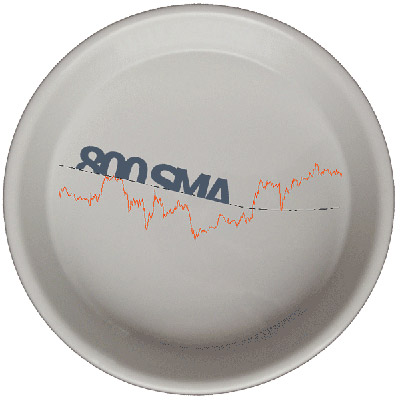
When a trendline matches up with a large Moving Average such as the 800 or 200 Simple Moving Average it usually acts as an attractor, so it can be used as a target for a counter trend position. In case you feel more comfortable following the trend you probably want to stay aside while a market corrects towards a large moving average or switch to a smaller time frame and trade the movement on that time scale. Don't forget that trend following and counter trend approaches are always dependent of the time frame used. You may detect a retracement to the 200 on a 4H chart and capitalize on those impulse moves that price is showing on a 15M time frame to reach that level.
In order to really succeed when trading with Moving Averages always refer to the conversion table displayed in Chapter B01. In this sense, a 200 period Moving Average on a 4H chart corresponds to a 800 Moving Average on a 15M chart.
Rob Booker took this abstraction a little bit further and created a complete new indicator based on the idea that a currency pair oscillates above and below its means. For trading purposes, he chose the 800 Simple Moving Average. This oscillation had to be measured in terms of distance and time, and like any other open oscillator, there had to be extreme levels where statistically the pair would tend to revert its course and initiate a return back to the mean, in this case a movable mean: the 800 SMA.
This is just one of the Economic and Technical View of the Currency Market recorded webinars by Rob Booker. Please feel free to watch all of them to get an overview of how this incredibly simple method can be applied.

This chapter is a collection of little pearls for you to take on your bag on the Forex adventure. You will not need all of the resources explained here to further build your path into becoming a professional trader. But even if you already have your way to do things and they work for you, it may be an interesting exercise discovering how other experts are capitalizing on the same ideas as you by doing their personal researches.
There is nothing magical about what successful traders do, they just use common analysis tools applied in a logical and consistent manner. What is perhaps the most surprising aspect is the amount of focus and specialization at which most of our experts arrived just by concentrating on a few aspects during a prolonged time. It's inevitable to feel admiration for what they accomplished and we think you can accomplish the same success too if you let them inspire you.
You probably have acknowledged that we have awesome specialists everyday presenting their ideas in form of analysis, blog posts, reports and webinars. This chapter aims to collect pretty much the best ideas from everyone. There are surely many more and more to come, but we let you find them out.
It was our aim to motivate you to test these ideas and reach, as a result of that experimenting, a lot of positive experiences with Forex. Reaching the end of the last chapter of Unit C you should now be quite prepared to stay alive in the market. If you manage to stay alive, then we have accomplished our mission here to date. But still, there is more to learn, don't forget to put your knowledge at work in the Practice Chapter and see you in Unit D!
Feel free to join our LC Forum at FXstreet.com and share your edges and the particularities from your trading, the same way as our experts have done for you.
What you have learned from this chapter:
- 20 different set-ups for all kinds of market conditions.
- Several combinations of indicators to take the most out of them.
- Many experienced traders vary in their terminology, but the essence of their trading methodology is very similar to other successful traders.
- There is no method better that another, it very much depends on the little nuances you get with experience.
- A good set-up does not necessarily need to be complicated.
FXstreet.com links:
- Technical Analysis MACD and MACD Aspray, by Valeria Bednarik
- Forex Basics Series - Technical Figures, by Valeria Bednarik
- Bollinger Bands and RSI, by Valeria Bednarik
- Looking for day-trades, by Adam Rosen
- Back to Basics - Moving Averages, by Adam Rosen
- Combining Candlesticks with Western Technical Analysis, by James Chen
- Live Trading Set Ups with Chart Patterns and Market Cycles, by Raghee Horner
- What is VWAP: How to Spot Institutions, by Mark Whistler
- Monthly Webinar: Harmonic Patterns, by Sunil Mangwani
- Trading the Harmonic patterns, by Sunil Mangwani
- MONTHLY WEBINAR: Learning to Read Price Action, by Chris Capre
- Professional Gaps vs Novice Gaps in the Forex Markets, by Sam Seiden
- Rule Based Short Term Trading In Forex, Sam Seiden
- Capture reversal points with the use of indicators and oscillators, by Sam Seiden
- Short term Forex Trading Strategies, Breakouts and Reversals, by Sam Seiden
- Low Risk Breakout Trading in Forex, by Sam Seiden
- Institutional Trading Strategies: Pivot Points, by Andrei Pehar
- Finding Your Entry, by Andrei Pehar
- Volatility Trading Strategies to Perceive and Defeat Forex Volatility through Traditional Indicators, by Mark Whistler
- Simple Trading Strategies to Perceive and Defeat Forex Volatility through Traditional Indicators, by Mark Whistler
- Perceiving Forex Volatility via Descriptive Statistics… Deriving Trending and Reversals − Part 2, by Mark Whistler
- Monthly Webinar: What Traders Need to Know About Today's Forex, by Mark Whistler
- What is VWAP: How to Spot Institutions, by Mark Whistler
- Monthly Webinar: What Traders Need to Know About Today's Forex, by Mark Whistler
- Market harmonics and Forex Trading, by Derek Frey
- My Favorite Patterns To Trade, by Derek Frey
- Trend Trading - Part 1: Elements of Trend Trading in FX and Futures Markets, by Don Wilcox
- The Contrarian, by Joseph Trevisani
- Catching Redfish off the pool: Trend Lines and Technical Indicators, by S.A. Ghafari
- Drilling down, Support and Resistance, by Triffany Hammond
- MONTHLY WEBINAR: Strategic & Tactical FOREX Trading (Part 1), by Wayne McDonell
- MONTHLY WEBINAR: Strategic & Tactical FOREX Trading (Part 2), by Wayne McDonell
- Economic and Technical View of the Currency Market, by Rob Booker
- Trading Strategy Essentials, by Phil Newton
- MONTHLY WEBINAR - How to manage risk using Price Behaviour analysis, by Mike Baghdady
- An introduction to Price Behaviour: Part 3, by Mike Baghdady
- An introduction to Price Behaviour: Part 4, by Mike Baghdady
- Strategies for Long Term Profits in the Forex, by John Jagerson
- Todays' Trading Signals Report Explained, by Kim Cramer Larsson
- MONTHLY WEBINAR - Part 1: Technical analysis: Price is the King!, by Lea Peters


