Topics covered in this chapter:
- Most of the common statistical figures disclosed in categories for a better overview.
- Many examples to understand why statistical data are flawed and meaningless when not contextualized.
- False myths about some core figures in a performance report which can lead to a never ending search for the holy grail.
- Statistical goal settings as a psychological driver in your trading.
- Statistical variables can unleash incredible benefits like how to drive the equity curve with their help.
If you have been studying the Learning center from the beginning, you probably noticed that becoming a trader is a serious career, but you want to know if you are on the right path and what is more important: if there is a way to measure how long it's gonna take to achive your goals.
When developing a strategy and building a personal path through the trading world, you need some sort of guidelines in order to know when you have moved from point A to point B, how long did it take to get there, and how much work has been involved. After all, any learning experience is a gradual process of achieving one plateau and then striving for the next one.
We insist that there is more to trading than just analysis and strategies, and Unit C is precisely about that: to take the next step into a better control of your trading destiny. You have now left the realm of the analysis taught in Unit B, and the idea is to start laying down a structured path in order to develop a personal trading methodology.
Trading is a tough business, it requires the development of certain personal traits and our premise at the Learning Center is that the path to become a consistently profitable trader can be created through a structured methodology and education.
There is something you need before trying to adopt one or another strategy or trying to trade based on text book patterns: to lay out a methodology that quantifies your edge. This is a process a lot of people simply skip.
Your edge is measurable, not only during the system development phase but also in your day-to-day trading. Setting statistical goals and defining probabilities of success once you have started to record your performance is much more realistic than sustaining an illusory dollar return.
With these ideas in mind, the first four sections of the chapter will disclose the most basic statistical figures, the ones you see along on professional track records, in a way that you can benefit from a broad overview and understanding of them if you don't have done it before in a detailed fashion.
Just as tools that help you follow price action, there are also tools to help traders follow their own performance in the market. In order to truly understand the trading environment, we have to see ourselves as part of that environment, and as such we need tools to measure our actions.
The key to this broader perspective - and critically important if we want to achieve our full potential as traders - comes from understanding how to think in terms of probabilities.
There is an ongoing debate among traders whether a statistical measurement of our performance, specially in a backtesting or in a demo mode, is useful or not. That is understandable, since statistics can mislead if not considered in a proper context or if used partially. To many aspiring traders, these tools are misunderstood if not unknown. Here is where the fifth section aims to shed light on and prepare you for more advanced subjects covered in future chapters.
1.Trade Statistics
The goal of these figures is to start evaluating the overall performance of a system or strategy by measuring each and all trades objectively. The figures disclosed herewith are considered the most basic ones and are by themselves not enough to establish a complete statistical report. Nonetheless, they serve as starting points to calculate more complex figures.
Total Trades
This is simply the number of all trades - winning, losing and break-even trades - opened in a certain period of time. Note that at any time of a track record this figure will also include trades that aren't yet closed.
Win Trades / Loss Trades
Win Trades are also called Profit Trades and it's the number of winning closed trades during the time period of a performance report.
Conversely, Loss Trades is the number of closed trades resulted in losses during the same time period.
There is a difference between a winning trade and a good trade. A good trade isn't always a winning trade, and a winning trade isn't always a good trade. A good trade is simply a trade that was executed following the set of rules designed to open and close the trades - independently of the fact that the result is a win or a loss.
Break-even Trades
This figure represents the number of trades that are neither winners nor losers. A break-even trade is a trade closed at zero profit. Because the cost of the trade is recovered in break-even trades, some people consider them winning trades. But for more advanced statistical measures, let's keep them as a separated class.
Maximum Win Trade / Maximum Loss Trade
This figure refers to the biggest Win Trade and the biggest Loss Trade - usually closed trades - at the moment of the report.
Maximum Number of Consecutive Losses
Regardless of how well a system performs, there is always the likelihood of losing strings. This figure registers the number of losing trades in a row.
Maximum Number of Consecutive Wins
The same happens when several winning trades cluster in a relatively short amount of time. This figure reflects the number of consecutive winning trades.
Total Commissions / Spreads
This is the total costs paid out for all positions in the form of spreads and/or commissions. This can be a decisive figure specially if the reported Trade Frequency of a system is high.
Total Slippage
It's usually expressed in dollar amounts, although a "Slippage Percent" figure may be used. A larger explanation of the phenomena can be found in Chapter A03.
Total Forex Carry
Another figure which belongs to the trading costs is money earned or paid as a result of Forex Carry (see in Chapter A03 how the Interest Rate Rollover is calculated).
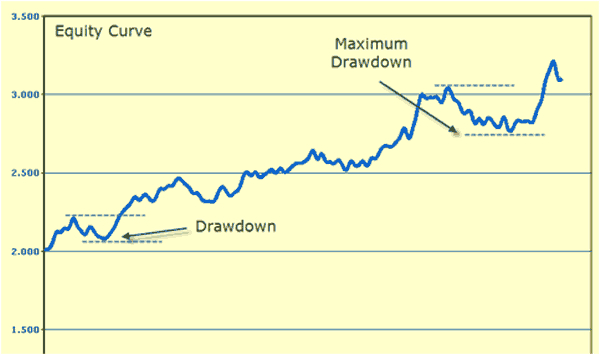
Equity Curve
This is not a statistical figure in itself, but a very useful tool: a quick review of a system’s equity curve can provide some additional insight into its performance. Equity curve charts tally a system’s individual trades to present a time line of trade-by-trade results in a graphic format.
By displaying the net profit curve it reveals equity Drawdowns (series of loses) and the gain periods (also called “run-ups”). Flat or non-trading periods are also shown to present the equity performance in a detailed graph.
What is important to notice in a equity curve is the magnitude and time duration of the Drawdowns. This graphic tool may be used at a portfolio level to match trading systems and offsetting periods of loss from one system with gain from another to create well balanced trading portfolios.
The below picture is the equity curve of the system introduced in Chapter C01, tested on the CHF/USD from July 2006 until January 2009.
Number of Closed Trades and Number of Trades in a Drawdown
Although this figure also belongs to the Drawdown statistics (covered in the next section), it's a trade statistic because it shows the number of closed trades comprised in a Drawdown, or number of trades including open ones. This figure is specially useful as unreported losing trades can hide a bad performing system.
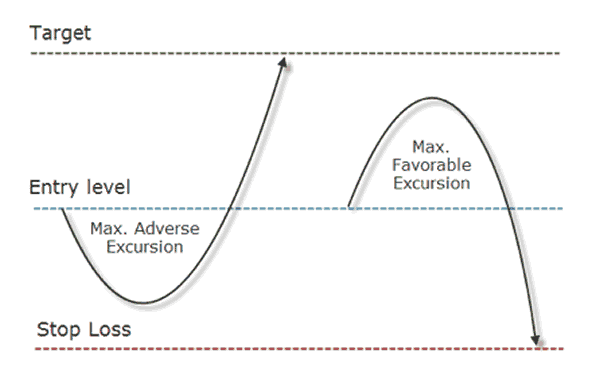
Maximum Adverse Excursion
This is the maximum potential loss that the trade had before the trade closed in profit. For example, a trade closed with 25 points in profit but during the time it was open, at one point, it was losing 100 points - that was the Maximum Adverse Excursion for that trade.
Maximum Favorable Excursion
Maximum Favorable Excursion is the peak profit before closing the trade. For example, you may have a closed trade which lost 25 pips but during the time the trade was open, it was making a 100 pips profit at some point - that was the Maximum Favorable Excursion for that particular trade.
This statistical concept originally created by John Sweeney to measure the distinctive characteristics of profitable trades, can be used as part of an analytical process to enable traders to distinguish between average trades and those that offer substantially greater profit potential.
Yet a professional trader knows that what matters the most is not whether a trade was a winner or not, or how much the profit was, but the way to arrive to that profit. If in order to achieve a profit it is needed to have a trade running strongly against us, the trading strategy is maybe not suited for our personality. For this reason, intratrade statistics are also valuable tools as they offer a criterion about the quality of the entry signals generated by the system.
They also help classify above-average performances during a trade and thereby recognize opportunities to enhance profitability - for instance by increasing the profit potential relative to risk by increasing the size of positions. A multiple entry strategy can be used with all types of systems, whether they are mechanical, discretionary, long-term or short-term. The system must, however, exhibit certain Maximun Favorable Excursions to take advantage of such a risk management strategy.