5. Reading a Performance Report
Recovering from a Drawdown
One number that new traders ignore, or usually do not put enough emphasis on, is the Drawdown. The Maximum Drawdown in particular gives you a very good indication of the "pain" the trader would have to endure to achieve the recorded Return Rate.
Following the same logic of the Drawdown calculation from the last section, we can agree that once your account is at, let's say, 6,000 US Dollars after an initial balance of 12,000, you need to make another 6,000 in order to recoup the losses. This means that even though you lost 50% from 12,000, you would need to make 100% on the 6,000 to get back to your original amount. Well, that sounds weird, doesn't it?
Let's put it with another example: if a trader incurs a loss of 20% on a 10,000 account, do you think he needs to make 20% in order to get back to break-even? No, he needs to increase the remaining 8,000 by 25% to reach 10,000 again (25% of 8,000 = 2,000).
It's important to put a word of caution here: plan your Maximum Drawdowns and strive to keep them between 20 and 25%. Once Drawdowns exceed this amount it becomes increasingly difficult to completely recover. We will show the importance of keeping Drawdowns within reason in this section.
An advice would be to look at the Maximum Drawdown that your strategy has produced so far, and expect to face a new Drawdown twice as big. Why? Because a registered Drawdown is always historical and a new one can always happen. As you know, past performance is no guarantee of future results. Thus, the next Maximum Drawdown might be much greater than the historical one. If your account, your system and your psyche can stand a Drawdown twice as big as the one you experienced in the past, then you have a sound control of your capital.
The difficulty in recovering from a Drawdown is while this figure grows arithmetically, the profits required to get out of it start to increase geometrically.
Notice from the picture below that as losses increase, the percent gain necessary to recover to break-even increases at a much faster rate. This illustrates the difficulty of recovering from a loss and why risk control is so important.
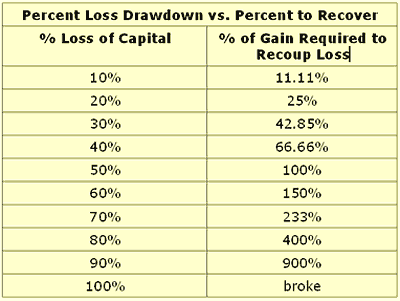
As you can see from the above illustration it takes only a few high-risk losing trades to severely damage your account.
Be aware of how difficult it is to recover from Drawdowns and develop an utmost respect for risk. In the next chapter we will see how to avoid taking huge risks through proper risk control and money management techniques.
One more caveat: beware of those performance reports in which the Maximum Drawdown is based on closed trades only (whereas it should say Maximum Closed Equity Drawdown). Some statistical measurements let losing trades stay open and do not reflect them in the statistics. The account equity, however, doesn't know the difference between open and closed trades. An open loss impacts your equity the same as a closed loss and depending on the account size, a single negative trade may lead to a margin call. So, make sure to distinguish all variants of the Drawdown figure in order to decide what is the minimum start capital required to trade a certain system.
Total Net Profit as an Eye Catcher
What elements of a statistical report you concentrate on will shape the view you get from that particular performance. Moreover: when measuring a trading system you can set your preferences as to what qualities it shall have.
Do you push for a trend following system with big gains but always watch defensively for a quick exit when wrong? Or do you prefer to slowly build up your account with small gains and be right more often than not? The path you take will be partly defined by your preference in one or another statistical measure.
As seen in the previous sections, there is a multitude of performance measures to evaluate trading strategies and methods. But looking at statistical figures like the Net Profit, the Win Rate, and the Return Rate, just to mention a few, has its flaws and never provides a complete picture of the historical performance. Let's have a look at how interrelated these measures are.
When starting to evaluate a system, it's understandable that we first look for the revenue statistics. But why is a figure such as the Total Net Profit, for example, not enough as a measure to judge a system?
Because it says less about a performance if it does not come with the distribution of the trades. Let's recall the lesson in Chapter A03 about the differences in pip values. Now imagine a system that trades an equal size per trade in a trending market. While trending, the pip value will change, and it may become less expensive to trade that particular currency pair. This would also mean that the dollar value of each trade may have decreased even if the average amount of pips didn't change. In this case, the profits would be unevenly distributed through time, but the Total Net Profit would not show this influence of price action.
Thomas Stridsman, explains by hand of a little analogy:
Imagine a downhill skier on his way down the slope to the finish line. About halfway down the slope, there's an interim time control. Let's say the skier passes that control after one minute, eight seconds. If the interim time control is one mile down the slope, then the skier has kept an average speed of 53 miles per hour. Now, although we need the interim time to calculate the average speed, it is not the interim time that gives the average speed: it is the average speed that gives the interim time.”
Source: “Trading Systems That Work: Building and Evaluating Effective Trading Systems” by Thomas Stridsman, McGraw-Hill, 2000, pag. 15
Usefulness of the Average Profit
The above analogy can be useful in understanding a statistical incongruity: if comparing two performances covering the same time period, and the two statistical reports show the same Total Net Profit halfway through the tracking period, we should immediately ask for the number of trades to assess which system is the best. It's not the same to achieve, let's say, 100,000 US Dollars in 250 trades than in 500 trades. The resulting Average Profit per trade becomes crucial here.
But, why not look straight away at the Average Profit per trade? The answer is: because looking at it alone does not provide a complete overview of the reliability or robustness of a system. Besides having in mind how many trades the report is tracking, if you don't know when these trades happened, you can not really be sure that the system is still profitable or not. It may have had the majority of trades during the first half of the tracked period, being the recent trades below the Average Profit value over the entire period. Alternatively, a performance showing that the Average Profit per trade is way below what can be expected as judged from the last few trades, that is, with the most profitable trades clustered at the end of the track record, raises some doubts as for the effectiveness of the system.
In order for the trader to decide on the parameters for the risk and money management, the performance record has to show that all trades influenced the Average Profit per trade equally. If there is too much fluctuation in the profit per each trade, it's more likely that the system will underperform and even cease to work completely when market conditions change.
How Much Luck is Involved?
Another of the most important factors when developing or considering a trading system is the percentage of profitable trades, what we have called the Win Rate. Let's imagine a report which shows a Win Rate of 70%: this means that the probability of having a winning trade is 70% – over 30% to have a losing trade.
Now, when trading such a system, don't be fooled if you see many consecutive wins or losses! Long series of successful or unsuccessful trades can have dramatic short-term effects, but the true is that it plays little role in the long-term success as a currency trader.
Here is why: you may think that out of 10 trades, 7 will be winners. When experimenting 3 losers in a row you might then expect to have a winner in the next trade because now the system's win probability is higher. But statistically, this assumption is nonsense. The probability of a profitable trade is still 70%, while the probability of a losing trade is still 30%. No more and no less.
Therefore, it's better not to rely too much on the theoretical probability of a large number of losing trades happening in a row. In other words, because the probability of a few losses happening in a row is very low it is not the same as the overall Win Rate.
On the other hand, it doesn't mean this cannot happen in your real trading. The chances of, let's say, five consecutive losses in a 70% Win Rate system can be calculated by multiplying 0,3 five times by itself (0,3 x 0,3 x 0,3 x 0,3 x 0,3) which results in 0,24%. Even if this probability does look very remote it's not a zero probability and quite likely to happen in real trading.
Based on this common misconception, some traders might even increase their position size convinced that now the probability for a winner is much higher, but in reality they are only increasing the risk. As a general rule, it is much safer to risk more per trade with a higher Expectancy or a higher Payoff Ratio, than after a large string of unsuccessful trades.
Among a large track record, the outcome of any single trade should be thus considered random and no guarantee that the next five or ten trades will not be all losses or all profits, for that matter.
The clustering of large number of profitable trades in narrow periods of time is closely related to the idea of luck in trading. That's why in real trading it's of utmost importance to think in terms of probabilities and stick to the statistical evidence of a track record. By doing so you can be prepared for such an outcome in advance and control the risk per trade.
The aim of this entire Chapter is for you to start thinking with a statistical mind. Only so you will accept the fact that risk control and money management - which will be covered in the next chapter - are not trivial subjects.
The lack of understanding of the Win Rate figure goes also further as many traders think that a higher percentage of profitable trades is better than a lower number - but it is not. It all depends on how it relates to the Average Profit per trade, the trade frequency and the duration of the trades.
Many profitable trading methods or systems achieve a nice Total Net Profit with a rather small Win Rate, sometimes much below 50%. Let's think of a report that shows a Win Rate of 30% - this means that from all the trades recorded, it lost 70% of them. In order to accumulate profits, the Average Winning Trade has to be much greater than the Average Losing Trade - maybe by following the axiom: “Cut your losses short and let your profits run.”
However, you need to decide whether you can stand a low Win Rate of 30%. Remember, such a rate doesn't mean that out of ten trades there will be seven losers for each three winners. You may face a much larger string of losses than seven trades.
If you think of a system with a trade frequency of hundred trades per week, having ten losing trades in a row in the same day has not the same meaning as in a system with a frequency of 10 trades per month.
Most beginning traders prefer a Win Rate higher than 50% because they feel more comfortable in being “right” most of the time. Unfortunately, many of them will, out of control, dismiss any system below their objectives, which is typically a 75% Win Rate or higher.
But you should know that trading strategies with smaller Win Rates can be profitable too. Since these data have to be observed in conjunction with other figures such as frequency or the Win/Loss Ratio, it will depend on the personal choices of each trader.
For sure many traders can't stand the psychological pressure to trade with low Win Rates - after a string of losses, they’ll modify the strategy with the aim of "improving" it, or stop trading it completely. The problem here is that they are not seeing the low Win Rate in a proper context, balanced with other statistical figures.
In any case, if you are just starting out it's advisable to gain confidence in
your trading by going with a methodology with a Win Rate of 50% or above. But note that mechanical trading strategies usually have a rate between 45% and 65%, so don't expect to find a mechanical method with a 80% accuracy. Those higher rates will be the result of your experience and only attainable in short and medium term time intervals.
The type of trading system you develop will usually imply a certain Win Rate. For example, very short term scalping methods may incur a high Win Rate but have a low Average Win Rate. Alternatively, breakout systems may reflect a lower percentage of winners but the Average Profit per trade is usually greater because of a better Win/Loss ratio.
The same happens when considering the time frames used: very short-term time frames may frustrate attempts to raise the Win Rate since a position should be right immediately after opening, while a position on a large time frame will usually wade through many whipsaws. before reaching the target.
On the other hand, intraday systems (traded on 4H time frames or less) are better shaped to control losses than long term position trading systems, because the incurred losses in a smaller time frame should be smaller (on average) than a position held a larger period of time.
Doing the Right Thing
Your perception about being right or wrong in a trade is hopefully changing by now. Did you notice how many professional analysts who regularly appear on the financial media are ranked because of how "right" they are on their trade calls? Or - what is the same: how Forex trading systems and signal services sold online claim such Win Rates as 80 and 90%?What you should be convinced of by reading through this chapter is that trading is not about being right, but rather, being consistently profitable.
If a systemvendorboasts a performance figure like "1,000 pips earned per month!", the first thing a statistical mind wants to know is what are the costs, the risks, the distribution, and so on, to get that amount of pips.
Being right is probably an important issue if you pretend to become an analyst and write in the financial media, but as a trader more important than to be right is to be right at the right time. Does it makes sense to predict that EUR/USD will be exchanged at 1,7500 when it is currently at 1,4800 if before going up as predicted it goes down to 1,2500? Unless you have a very deep pocket to sustain such a large open trade Drawdown, you can lose a lot of money even though the trade ends up being profitable.
So, don't be reluctant to take losses because of a strong belief in your analysis, otherwise one day you may get wiped out by a big loss. Losses left open tend to get larger and larger, making the situation even worse.

Hopefully by now you understand that being right is useless unless you have the timing right. Instead let's look at the above example from a different standpoint of view: what if we didn't care about being right, but we knew that every so often the market only affords a few of those impulse moves that are not part of the daily noise and try to catch the meat of those moves? We might lose a few times as we try to catch them, but if we maximize our gain and increase our size when we finally become "right" and catch part of the move, then we start becoming very profitable. The key is having a positive expectancy.
Systems with a moderate Win Rates are many times better long run systems. How do you know it? Again, a simple calculation of the expectancy tells you that.
The important thing with expectancy is that if it is less than zero, you have the odds against yourself and you will lose like in a casino in Las Vegas where the house has the long-term expectancy below zero for the player. That being said, look more at expectancy, and less at winning percentage. In fact, trying to be right just by having a high Win Rate is usually a recipe for disaster.
Summing Edges is the True Expectancy
It's easy to assume that trading aspects which have been so widely advised, like that the “Average Profit should be higher than the Average Loss”, or that “the Number of Winning Trades should be higher than the Losing Trades”, must be good to follow. After all, most of these recommendations are logical: shouldn't any potential profit be as big as possible, and any potential loss occur as few times as possible? The answer is: not necessarily.
Many of these figures are coupled. Did you noticed how they repetitively appear in the calculations of other statistical figures? For instance, many people assume that to raise the expectancy all you have to do is raise your win/loss ratio. But it doesn't work like this: if you attempt to raise your profit potential and reduce your loss size, all other things equal, your win rate will decrease. At the same time, this means that your equity curve will experiment larger clusterings of losing trades. On the other hand, if you keep all else being equal and decrease your profit target with respect to your loss size, your equity curve will have smaller increases in price and more abrupt Drawdowns.
By taking a deeper look at the relationship between the different figures, you see that commonly-held beliefs about statistics are sometimes over-simplistic.
The point at the end of this chapter is that changing any one of the quantities in the equation above by modifying the system's rules may itself NOT increase the expectancy. Your positive expectancy only comes from having an edge. If you don't have an edge, all the money management rules ever taught will not help you.
It's going to take time to master the different aspects of fine-tuning your trading with the help of statistical data. But we strongly encourage you to continue your education by reading the related material and the books quoted in these pages.
Along the way, you will gain knowledge, experience and confidence, and the pieces of the trading puzzle will fall into place. Join our LC Forum at FXstreet.com and share your experiences!
What have you learned from this chapter:
- The markets can be more or less random but statistics don't.
- A statistical measure of your performance will help you to leave the mechanical stage and start applying more discretion in your decision making process.
- Statistics can drive the equity curve volatility.
- Your goals must be in sync with where we stand in the learning process.
- It takes only a few losing trades to severely damage your prospects as a currency trader.
- Being guided by one sole statistical figure, or give too much importance to it, can mislead you and cause harm to your trading account.
FXstreet.com contents:
- Understanding the simple rules of Money Management – Part I: The Risk-to-Reward ratio, by Sunil Mangwani
- Day Trading Series - Chapter V: The 10 Power Principles of Successful Trading Strategies, by Markus Heitkoetter
- Recovering From Big Losses, by Rob Booker
- Five Steps to Consistent profits, by The Trader's Journal Collaborators
External links:
- Random Price Movement, Forexfactory Forum
- Monte Carlo Analysis, by Michael R. Bryant
- Win To Loss Ratio, by Adam Milton
- Risk To Reward Ratio, by Adam Milton
- The Myth Of Profit/Loss Ratios, by Grace Cheng
- Standard deviation, by Wikipedia.org