2. Concepts That Work
Ask any technical trader how he or she profits from the market and you will get probably two types of answers. Depending on his or her answer, you will see if he or she is an experienced trader or not. If the trader is inexperienced, he or she will point you to an indicator. “This indicator with such setting is needed to effectively determine price patterns,” is more or less the usual answer. On the other hand, the experienced trader will transmit you in a few sentences what the concept he or she tries to capitalize on.
In reality, anything that one indicator can do, two complimentary indicators can do it equally well or better. It's not so much about the tools, it's about the concept- here is where you really have to start. Once you get the concept, several tools can be used to the same end.
Technical analysis techniques range from the opaque and incomprehensible to amazingly straightforward and stunningly effective. From a practical and educational point of view, the second group is favored. The selection of trading concepts discussed below aims to pick the essence of some effective strategies used by our experts and extract the ideas which lie behind them.
The reason why previous Units deal with the trading mechanics and types of analysis and tools was to prepare the student to make better use of more complex lessons. There is now a greater probability that you will not just copy the tactics presented here, but rather make them you own. Should you have just breezed through the previous tutorials, you can always check back as they are the foundation of your trading education. But now you are in a position to develop that knowledge into something more personal. You sense of analysis is more accurate, and you can start to combine the elements creatively.
Comprehension + Confirmation = Confidence
The above title is Raghee Horner's formula to put all the pieces together. Comprehension is about understanding what you are using. If you decide to use an oscillator, it's not because someone says it works, but because you know what this tool is for- maybe you have seen how it is calculated, you are familiar with its pros and cons, and your have tested it on your own. Adopting or supplanting any tool will always hinge on whether the tool is useful for your decision making or not.
And here is where Confirmation starts: you acquire the confirmation by verifying and testing. Note that testing is not just plotting the tool on the chart, you want to see it across multiple pairs, multiple time frames, and under several market conditions.
If we see a strategy working, each trade will further confirm that you’re doing the correct thing. Whether it takes a short time or a large time to accomplish it, that will depend on many factor but not on the tools themselves, so please don't spend your time switching tools without a proper method. Do your homework! Every trader has a different threshold for confidence and once you earn it, protect it, just like capital.
Once you have visual conformation that an indicator supports your concept, you start to gain Confidence, the third “C” from Raghee's formula.
Raghee, like all our experts, are great communicators and will transmit their ideas and concepts intelligently. But that will not save you from going through all the required stages.
Prepare To Anticipate The Crowd
Identifying and executing low-risk entries are the hallmark of a consistently profitable trader. Sometimes this involves acting against what seems evident on a chart. Let's recall our lessons on price action by quoting Gabe Velazquez, “If you can't spot it, don't trade it,” from his article in The Trader's Journal:
Of all the facets of trading, the first that a new trader must learn before he can engage the markets with any degree of confidence is the identification of low-risk entries on a price chart. Notice that not just any entry will do, it must be those entries offering the biggest reward for the least amount of loss potential.
If you have ever read about or had the chance to chat with any successful trader, you will find one common thread. They all (without exception) have an edge based on low-risk entries.
What defines a low-risk entry? I define it as the following– the price level where a trader can expose the least amount of capital to prove whether his edge will work. I tell students to look for these areas by identifying “the line in the sand” or “drop-dead level” where price has to hold. Generally, these are found at prior inflection points on the chart.
The below image shows and example of a low-risk entry level. Notice how the proximity of the recent support and the 200-SMA provide effective protection for an eventual stop-loss placement.
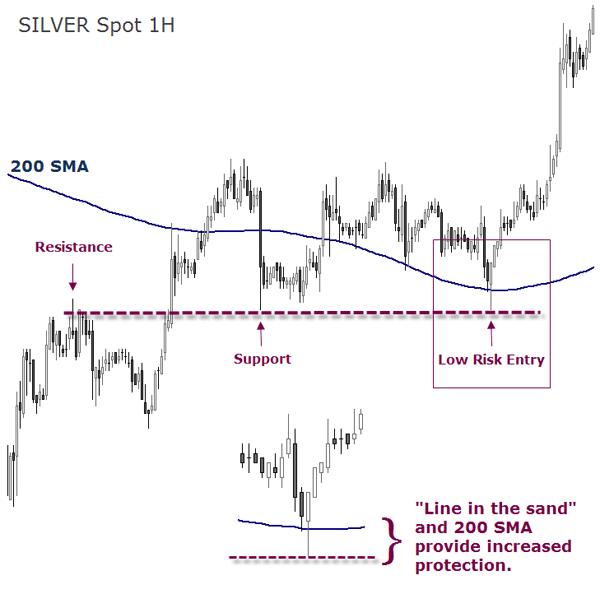
Once a trader learns the skill of identifying these levels, the biggest challenge is putting on the trades. Why do I say this? All of these trades were being placed when price is either retracing or the market was moving strongly into one of these areas.
Develop Several Strategies
Van Tharp recommends:
Develop several strategies that fit your view of the big picture and understand how each of these strategies will perform under various market types.
The ultimate goal of this step is to develop something that will work well under every possible market condition. Actually, it is not that hard to develop a good strategy for any particular market condition (including quiet, sideways). It is very difficult to develop one strategy that works well under all market conditions – which is what most people try to do.
Define Market Conditions
Before you decide what tools to grasp out of your toolbox, you need to know what market condition is currently prevailing . Bob Hunt suggests to differentiate market conditions based on momentum:
An effective means of identifying such short-term intraday market-turning points involves an evaluation of the momentum behind successive market swings. Price momentum is the measure of the rate, or speed, of price change. Normally, if we are to expect successive market swings to continue creating new highs or new lows, we would expect the rate of price change to increase along with the move to new highs or new lows. If successive swings do not have an increase in momentum, the validity of any new push higher or lower is called into question.
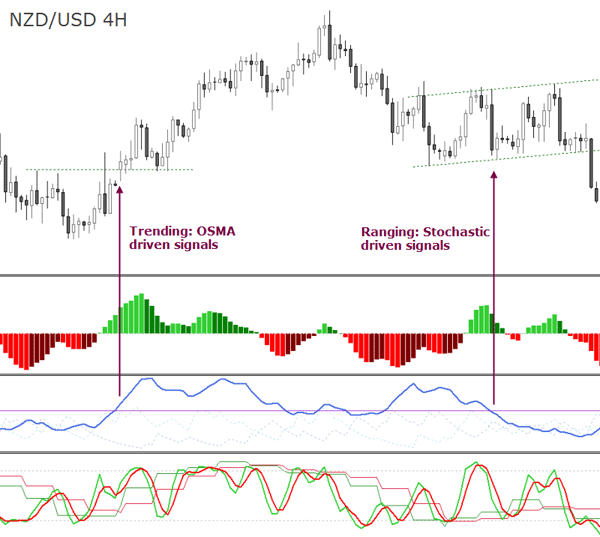
Several of our experts offer genuine ways to differentiate market conditions. Andrei Pehar, who has a flexible and surgical approach to trading, makes use of the ADX. This indicator tells him whether to use an oscillator for ranging markets or a momentum indicator for trending markets. Andrei likes to quantify the market's condition, and in order to do it he lets a specific indicator give him an objective answer.
The chart below shows the ADX calculated for the last 14 periods. When its average line shows a value above 30, the market is in a trending mode, and, when it is below 30, the market is in a ranging mode. When the ADX line is above 30, Andrei uses the OSMA indicator to look for momentum, and, when the ADX line is below 30, Pehar switches to an oscillating indicator, in his case, the Stochastic.
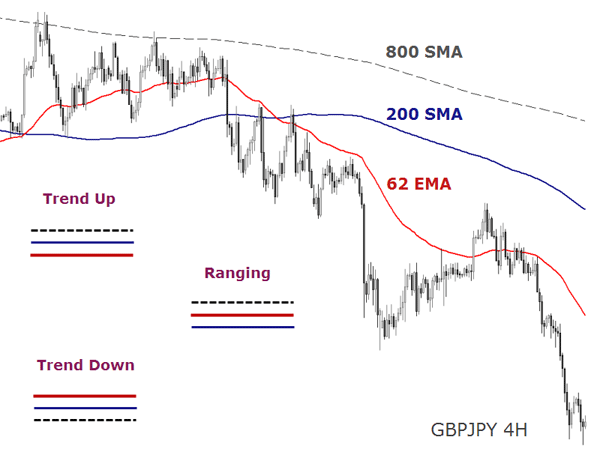
Rob Booker, in the context of his Arizona Rules, establishes market phases depending on the alignment of three Moving Averages. The chart below shows how the GBP/JPY remained ranging while the 62-EMA was between the 800-SMA and the 200-SMA
.
Raghee Horner interprets the market as being in one of the 4 cycles depending on the disposition of the wave lines : “mark up”, “mark down”, “accumulation”, and “distribution”. The psychological characteristics of each cycle are “greed”, “fear”, “boredom”, and “confusion”, respectively. And there is a set-up for each one of these market moods: trending following, trend reversal, momentum or range-bound set-ups. This is done by interpreting the angle formed by the three EMAs relative to the price/time axis, in the way Charles Dow did.
Find here several recorded webinars by Raghee Horner to learn more about her “Wave” and her “Lasy Days Lines”.
Phil Newton's method, similar to the 1-2-3 rules from classical technical analysis, can be used to detect market phases and bias changes. With this simple method he can answer the question as to where the market is going, if up, down or sideways.
His swing high/ swing low definition helps to identify these market phases by a simple count of these swing highs and lows.
- The market is going up when price is making higher highs and higher lows.
- When price is making lower highs and lower lows, the market is moving downwards.
- When price is not making higher highs and higher lows OR lower highs lower lows, then it is in a ranging mode.
A bias change from long to short (from bullish to bearish) occurs when the following sequence develops: HH → HL → LH → LL → LH
When price moves below the last lower low made, the bias change is confirmed (see left side sequence).
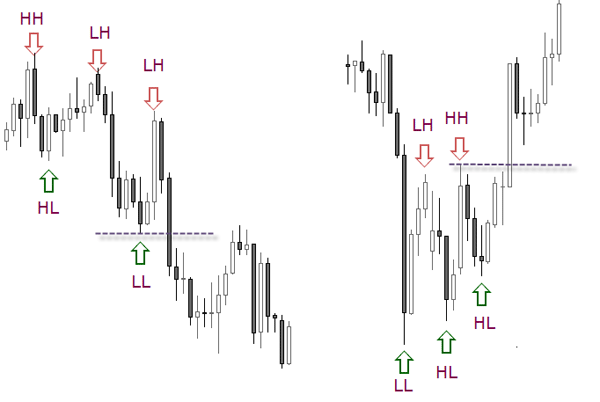
The long or bullish bias change occurs when the opposite sequence develops (see right side sequence): LL → LH → HL → HH → HL. The bias change is confirmed when price moves above the last higher high made as highlighted on the chart.
Another way of saying this is a 123 reversal and you are trading the pullback as your entry trigger (dotted line).
As for ranging markets, Phil's rules dictate that if price is not making new highs nor new lows, then the mode is ranging.
This happens when price stalls and stops printing new swing highs or lows, and stays contained within the last swing high and low. Until the price doesn't break out of this range, there is no trending condition. Each new swing high or low inside the range just confirms the ranging condition.
Successful range trading in the Forex market involves more than just visually seeing a range. You have to define what is ranging for you, and trade accordingly. This is the reason why we are showing you different modalities to structure price action: none of them are “truer” or more valid than the others- but they all work well for their developers.
Our advice is to avoid complex trading methods from the beginning. The reason is because the only elements that can give you an edge are your understanding of the market behavior and the understanding of what your indicators and rules are interpreting the price action. Once that is achieved, by sticking to what the simple indicators say, passing the lessons on psychology (Chapter D01) and taking all the risk control measures, you should be just fine.
Are crosses better suited for range trading?
Typically, pairs that do not involve the USD are more suitable for range trading because the USD is a trending currency. In general, cross-currency pairs are more prone to stay within a range. During 2009, for example, pairs such as the EUR/CHF, GBP/CHF, EUR/JPY, AUD/NZD, GBP/JPY, have shown ranging behavior. One exception was probably the GBP/USD which did hold relatively well within a range through the last six months of 2009.
The reason may lie in another factor that can play a large role in determining ranging movements - the interest rate differential between two economies (currencies). Pairs with low interest rate differentials are also suitable for range trading.
But just because certain pairs show these two prerequisites it doesn't mean that the pair will indeed trade within a range for a long time. A currency may experience an increase in volatility because of extreme circumstances and it may take a long time before it stabilizes again.
Breakout Nuances
Breakout trading is often associated with price ranges. It can be simple, rule based and very profitable if you don't let emotions interfere with your decision making, either by prematurely entering a trade or by taking high-risk and low-reward set-ups.
Sam Seiden teaches a type of entry breakout strategy to pick those low-risk and high-reward trades. Similar to the “Dop-Base-Rally” in Renshi's examples (see above), Sam's set-up also requires that the consolidation area is preceded by a strong movement in price in order to see the probability of a significant breakout increased.
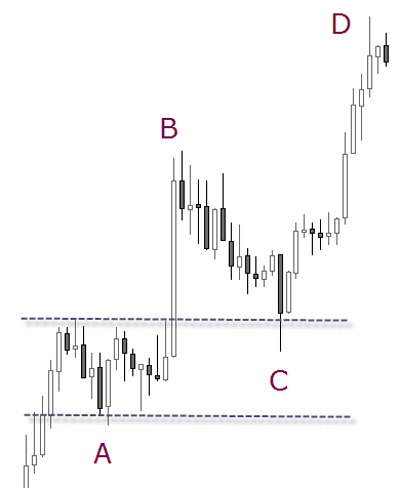
Sam Seiden explains the set-up illustrated above:
When it does at “C,” I am a very interested buyer as I am confident that I am buying from a novice seller. I know this because the seller at “C” is making the two mistakes that every consistently losing (novice) trader makes. First, they are selling after a period of selling and they are selling at a price level where demand exceeds supply.
Consider this action-reaction play between supply and demand (see Chapter B04) when adhering to price momentum. This simple technique demands rather complex planning and detached execution though. Such effective strategies require trading opposite to natural bias, that is, entries on counter-trend reactions and exits on accelerating thrusts.
A basic requirement for profiting from impulsive market moves is to align your positions to the underlying trend but against the current crowd emotion. You may also enter when price is already accelerating but you should not forget to exit when further acceleration happens and never wait for the inevitable pullback.
In the first half of this video Andrei explains how to spot a retest of a broken level. There are some nuances to it like how far does the exchange rate has to come back to the range to be an effective “test”. Andrei's ideas are much in line with Sam's in the sense that the first breakout is more risky and it's probability much lower. If you want to see precision and flexibility at trading, Andrei is a great example to follow!
The Bull and Bear Traps
Often, breakouts of a support or resistance level don't see sufficient follow through buying or selling. Instead, the market reverses back inside the previous range. Even though the previously quoted experts offer outstanding guidelines on how to trade this price action, we wanted to add Howard Friend's lessons since they follow the same line of thought.
His theory is that many of the explosive moves in price occur as the result of false breaks of support and resistance levels. This means that for a large move in a given direction to happen a significant number of traders must be incorrectly positioned.
It's the emotional crowd, the vulnerable traders, who ignite sharp price movements. They chase positions just behind the big volume, where odds of a reversal quickly increase. It's a frequent phenomenon when greed clouds risk awareness.
Howard Friend explains:
The market advance is exacerbated by the ‘wait and see’ crowd who come in after most of the cards have been played, and the ‘buy low’ crowd who add to their longs having been rewarded for their bravery in resisting the downside break. The resulting rally often lasts for several price bars, presenting a lucrative trading opportunity for the swing trader.
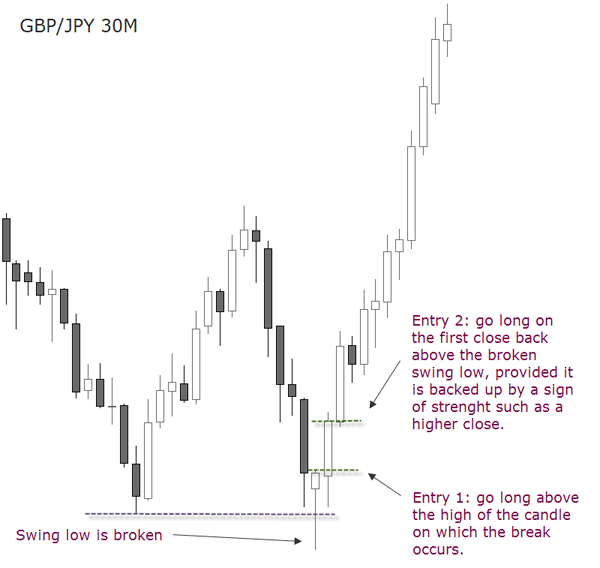
There are two ways to entry the position once a “trap” is detected: either you enter with a stop order a few pips above the high of the “trap” candle, or you wait for a close in the direction of the “trap” candle”. Notice in the image below when the market breaks above the high of the candle on which the break occurs, that all of the sellers of the swing low break were be trapped and their positions were losing money. They had to cover their short positions, bidding up the price, and this is this move we are trying to capture.
Only unskilled traders fail to consider this rationale when entering momentum trades. They position themselves incorrectly executing market entries on accelerating thrusts. Once a sharp countertrend starts to destroy their floating profits, their stops contribute to escalate the virulence of the counter move. Only when massive stop loss clusters and margin calls are completely detonated, then momentum sinks.
Now you know something more about executing low-risk entries, how to ride a thrust into profits and exiting a subsequent reaction. You can avoid the experience of turning a winning position into a loss using the above defined tactics. The idea is to gear your trading with concepts that work in all kinds of market conditions.