4. Exit Strategies
It is easy to get into the market, there are so many different techniques...but what about getting out? There is a vital difference between a trader who has an exact exit plan or none at all. It doesn't matter if the positions are in a profit or going down in flames, as a trader you really need two exit strategies: one to handle profits and another to handle losses. And when dealing with profits, you also need to know how to protect them.
Therefore, exit planning covers a stop-loss strategy to get out of bad trades, a profit-protection strategy to exit winning trades, and another strategy to save your neck in case of unexpected risks. You'll need all three tactics in every trade, because anything can happen once you hit the order button.
Andrei Knight breaks the elements of a trading methodology down into 50% money management and 40% psychology. Guess how the remaining 10% is distributed? Knight gives 8% to the exit techniques and the last 2% to entries. Stops, taking profits and managing the position makes up the 8%.
Usually, when we think about a strategy or a trading system, we think in terms of entry criteria, whereas exits are the levels where you actually gain or lose money. This is one of the reasons so many people fail, not because they are bad analysts or have poor entry rules- it's because exit rules are almost nonexistent in their trading approaches.
Novice traders usually start trading with a price-based exit strategy. They enter into a position, and, when it moves into profit, they exit the trade "blind" at the target price. This means they take the money and go, without considering the current price action. But what if there is still potential in the price movement? How do you protect the profits if you want to stay in the trade for longer? There are several ways to make a decision. The chart below outlines what may happen after opening a trade and the common stages it goes through:
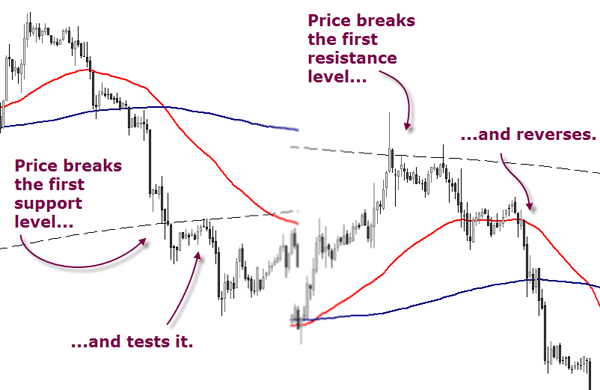
The action/reaction may continue until the exchange rate hits your stop or it hits the final target. In this section, we want to focus on those elements which tell the trader when to move the stop in order to protect profits, or when to exit the trade entirely. Throughout the Learning Center we have seen some techniques, for example, on how to spot price action within shorter-term time frames (Chapter B01), or how moving the stop to breakeven can enhance your overall statistics (Chapter C02).
But you may find exit techniques like these too simple: “get out as soon as price breaks support on a long trade, or resistance on a short sale”. There are indeed at least two problems with them which demand further detail. First, many people lack the discipline to take losses when they should be taken; and second, you may not fully understand how to place stop losses.
Do you get frustrated because your stops get hit frequently on good trades? If the answer is yes, then probably the fault lies in your analytical skills and trade management, not in the stops themselves. Let's see some practical suggestions for stop placements based on technical tools.
Managing the Position
Sunil Mangwani says that Pivot Points, unlike lagging indicators, are very effective from the risk point of view, since emerging stop levels are very clearly defined. He states:
Indeed, Andrei Knight, who also uses daily Pivot Points in his intraday trading approach, can sustain that view. Discover with him one of the best kept secrets of bank traders. Pivot Points and their medians have long been a favorite of the biggest institutional players, and since they are the ones who move the markets, once you know the likely places for their pending orders, you also know the most likely levels for reversals. But too many traders calibrate their Pivots incorrectly since they lack an understanding of their meaning and how the markets work. In this webinar, fund manager and trading coach Andrei Knight will take you inside the world of institutional trading and show you step-by-step how to set up and use Pivot Points.
Price has an uncanny way of respecting not only Pivot Points, but also Fibonacci ratios, often quite precisely. Traders in highly liquid markets such as the Forex use the Fibonacci ratios to ascertain the technical levels, which become effective stop levels to manage an open position.
A powerful combination is the result of Fibonacci levels AND Pivot Points. Professional traders pay special attention when these two indicators are confluent and the exchange rate snaps to these levels in a clear manner. Did you attend the amazing speech by James Chen on confluences during the ITC 2009?
Related to the same topic, we also find Joe DiNapoli's assumption that some Fibonacci levels are more effective than others to determine future price action. While it's true that prices does not express themselves in the same exact, mechanical manner each time they react to a Fibonacci level, this tool is capable of providing us with the ability to make price forecasts characterized with an improved probability of outcome.
In an effort to simplify the Fibonacci retracement and expansion ratios, Joe DiNapoli only uses the 0,618, 1,0 and 1,618 ratios and ignores all the other numbers derived from the series.
COP = O.618 (B – A) C
The second objective is the ‘objective point’ (OP), which uses the Fibonacci ratio 1.0:
OP = B – A C
The third objective is the ‘expanded objective point’ (XOP), which uses the Fibonacci ratio 1.618:
XOP = 1.618 (B – A) C
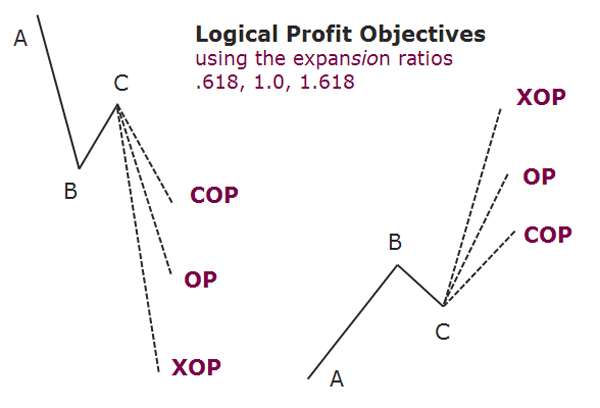
The author suggests to calculate these “logical profit objectives” from any ABC market swing, whether the thrust is up or down. You might choose to take all your profits at one target level, or you could “peel off” the position size at each target. He proceeds by explaining:
Note that, when using logical profit objectives, significant selling will be manifest at all three objective points in an up move, while buying will occur in a down move. You cannot be sure of the extent of the resulting reaction, only that the activity will occur. There’s nothing wrong with exiting partial positions at each objective as it is met.
ATR For Trade Management
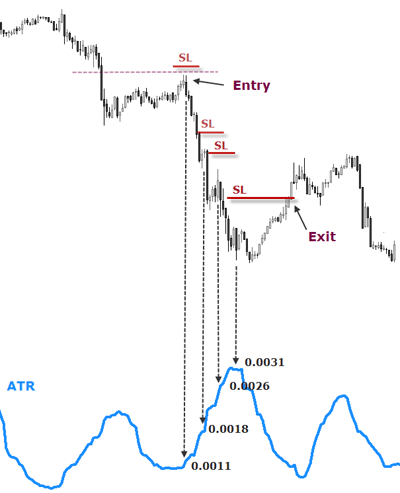
Stops and targets can also be managed with the Average True Range indicator if you prefer to set stops, trail stops, or set objectives based upon volatility. You can even use this tool to assist you in position sizing.
The below chart displays a short entry with a ATR value of 0,0011. The stop is thus placed 11 pips above the high of the entry candle and the target another (11) pips below the entry price. If the exchange rate reaches the target, you can liquidate your entire position or close it partially. The remaining lots can be trailed by at ATR value above the most recent swing high.
As for the position sizing, Joe Ross explains:
If we want to get long at 1.3296, we will place a loss-protecting order at 1.3016 (1.3296 – 0.028 = 1.3016), which amounts to $280. That means we can trade five lots and stay within our $1500 risk amount.
But what do we do if the ATR number is too high? For example, what if the ATR was 0.0418? Assuming the same entry at 1.3296, subtracting 0.0418 would cause us to have to place our loss protection at 1.2878. Can we safely handle a $418 loss? We can if we lower our position size to three lots.
What we can learn here is that if the ATR, which is an expression of volatility, becomes too great for our risk tolerance, we can opt to pass on a trade in this market. Or we can drop down to a shorter time and trade there. A shorter time will give us a lower ATR number.
Channel Exits
Another method of trailing the stop is commonly referred to as a “Channel Exit”. Quoting Charles LeBeau in one of his articles for the Trader's Journal, we can read:
[...]
A channel exit is extremely versatile and can work equally well with weekly bars or five-minute bars. Also, keep in mind that any examples referring to long trades can be equally applicable to short trades.
[...]
The implementation of a channel exit is very simple. Suppose we have decided to use a 20-day channel exit for a long trade. For each day in the trade, we would determine the lowest low price of the last 20 days and place our exit
stop at that point. Many traders may place their stops a few points nearer or further than the actual low price depending on their preference. As prices move in the direction of the trade, the lowest price of the last twenty days continually moves up, thus “trailing” under the trade and serving to protect some of the profits that have accumulated. It is important to note that the channel stop moves only in the direction of the trade. When prices fall back through the lowest low price of the last twenty days, the trade is exited using a sell stop order.
A longer channel length will usually work better in a long-term trend-following strategy, while a shorter channel will usually capture more profits in smaller trends. LeBleau suggests, among other variants, a trailing exit set at the lowest low or the highest high of the last 20 days or more for long term trend following strategies, between 5 to 20 days for intermediate term strategies, and between 1 to 5 days for short term strategies. But we recommend to test these parameters with your preferred currency pairs before adopting this exit mechanism.
The advantage of setting stops using a technical formula, is one way to move your stops away from the clusters where the majority of market participants set their stops at. This way, you can achieve better executions on your exits and lower the probability of a stop run.
The method of taking those profits which are on the table works best when you are trading counter trend since the anticipated amount of profits is relatively limited. We have seen it, for example, in Toni Juste's Money management model (Chapter C03) and also in Andrei Knight's Institutional Trading Strategies series. However, to take quick profits in a trend is usually frustrating when we see the price continue to move in our trade direction without us. Therefore, we recommend exploring different profit taking strategies to get the most out of each trade's profit potential.
More comprehensive studies of trading strategies are provided in the Trading Strategy section, which is constantly updated through regular add-ons like Raghee Horner's Waves, Phill Newton's bias change rules and Andrei Knight's use of the ADX, just to mention a few. We encourage you to explore the transcripts areas of the Live section as well if you are seeking more information.
We hope you enjoyed this chapter. One remark of interest should you still be trying to fit the puzzle pieces of your trading system together: think that those who have the most toys will not win, but rather those who have the most knowledge and can change their behavior.
What you have learned from this chapter:
- Thinking in terms of concepts can help you achieve the edge required in your pursuit of long-term consistent success.
- Markets inhale and exhale as dynamic trends evolve. There are strategies for all the phases.
- The most robust and versatile systems are build on several strategies.
- The very same concept or hypothesis can be capitalized on using different indicators.
- Finding Your Entry, by Andrei Knight
- The Death of the Buy−and−Hold Investor, by YourTradingEdge Collaborators
- If you can't spot it, don't trade it, by The Trader's Journal Collaborators
- Five Steps to Consistent profits, by The Trader's Journal Collaborators
- Introduction and Oscillator Divergence/Momentum Confirmation, by Bob Hunt
- Trading Ranges, by Andrei Knight
- How to Trade Consolidation, by James Renshi
- Breakout Entries, by The Trader's Journal Collaborators
- Institutional Trading Strategies: The "Smart Stop" System, by Andrei Knight
- http://old.fxstreet.com/education/trading-strategies/swing-trading-techniques/2009-12-22.html
- Swing Trading Techniques, by Forex Journal's Collaborators
- Economic and Technical View of the Currency Market, by Rob Booker
- Riding the curves, by Forex Journal's Collaborators
- Using Stops effectively, by Forex Journal's Collaborators
- Institutional Trading Strategies: Pivot Points, by Andrei Knight
- Video Interview with Andrei Knight: How to improve your Fibonacci reading, by Mauricio Carrillo
- Fibonacci Profit Objectives, by The Trader's Journal Collaborators
- Exit Strategies for Currency Traders, by YourTradingEdge Collaborators
- Using trailing stops in a trading System, by The Trader's Journal Collaborators
- How to Trade Forex using Fibonacci Price Relationships, by The Forex Journal
- How to Successfully and gainfully trade Failure setups, by Mike Baghdady
- Institutional Trading Strategies: The "Smart Stop" System, by Andrei Knight
- Trading with the ATR & Bollinger Bands, by Adam Rosen
- Technical Trading Strategist in the short and longer term, by Valeria Bednarik
- How To Identify And Trade A Wide Range, by Steve Misic
- Multi-time frames for entry and exit signals in Forex, by Peter Leonidou
- Ichimoku Trading: Strategies, Setups and What to Watch for, by Chris Capre
External links:
- Forex Volume on Metatrader, by phytrade.com
Books:
- “FOREX Patterns and Probabilities”, Ed Ponsi, Wiley Trading, 2007