3. Flexible Tactics
The objective of the trader who wishes to profit from every market condition is to adhere to a directional price movement while taking advantage of the possible corrections or breakouts. However, profiting from a trend or price thrust is far more difficult than most participants admit. Especially for a neophyte, it's easy to fall under the spell of a fast price movement. A large Marubozu candle formation, for example, awakens the greed of potential gains and clouds any risk-control measures (Chapter B04). But an astute trader, looking for the path of least resistance at any given time, will not be lured by the fast price action and will try to act contrary to the crowd.
That prices rarely move in a straight line shouldn't be new to you anymore. Throughout the Learning Center, it has been explained from several points of view how shocks destabilize a market and why counter forces emerge to restrain price back toward its equilibrium. These constant whipsaws in price exhaust the crowd's money, and once rid of the inexperienced participants, the market proceeds in the most probable direction.
Under this perspective, divergences are a superb tactic to train the required flexibility to switch from a trending mode to a counter trend.
Hidden Divergences
While the Regular Divergence is more commonly used (see MACD Divergences in Chapter B01), the Hidden Divergence is far more effective as Sunil Mangwani explained to us at the 2008 International Traders Conference. Let's see why hidden divergences are an effective way to recognize fake counter-trend movements.
The Hidden Divergence, which is a discrepancy between the price and an indicator, can be defined as:
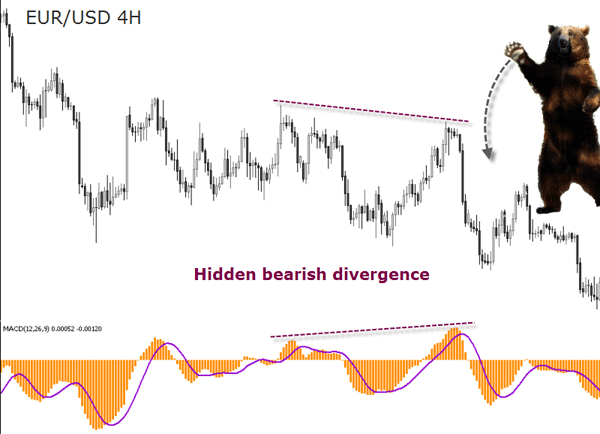
- Bearish Hidden Divergence - Lower highs in the exchange rate and higher highs in the indicator signals a downward movement.
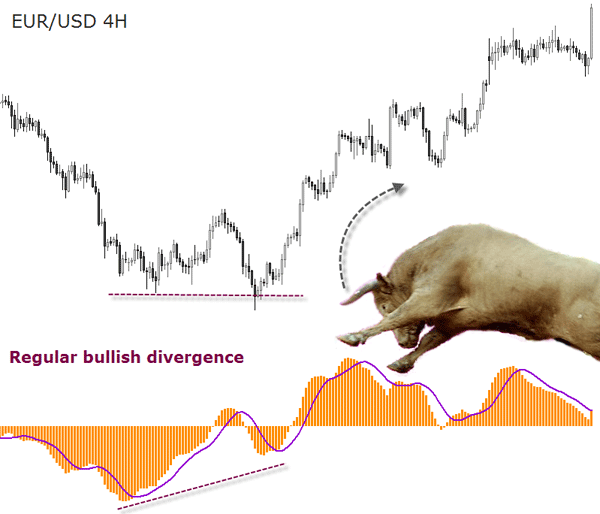
- Bullish Hidden Divergence - Higher lows in the exchange rate and lower lows in the indicator signals an upward movement.
In order to trade divergence set-ups either the RSI, MACD, CCI, Slow Stochastic, or any other oscillator or momentum indicator can be used. In the example below, the MACD has been used:

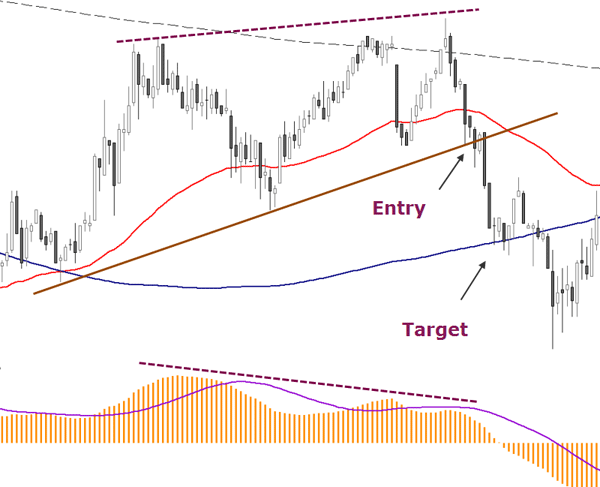
This set-up has the advantage, as Sunil explains, that it follows the prevailing trend, and by helping the trader adhere to it, it has a higher probability of success. Another advantage of this set-up is that it provides precise entry, stop and exit levels.
He conveys that hidden divergences “act like a catapult” on the price action. In our example, the allegory is a bear attacking from above, and forcing prices down.
In the process, price snaps back to its original trend, which give way to strong moves.
A possible question from Practice Chapter PrD would be: If the MACD histogram makes a divergence, does it mean that the MACD is also making a divergence? Acquire ground knowledge and learn a lot of precision tricks with hundreds of similar case studies, illustrated with charts and extra explanations.
We suggest developing a trading system comprised of three or four strategies and applying the system to one currency pair rather than using just a single-strategy system and trying to apply it to several pairs. If your system is made of just one strategy, it will probably be made just for one market condition.
A tactical diversification is better than diversifying your portfolio by trading several currency pairs at the same time, specially if these pairs are correlated (for example, pairs including the USD).
Regular Divergences
Regular divergences are also high-probability filters for false breakouts - the above mentioned “bear or bull traps”. Using a slow stochastic, or a MACD, for example, the trader can see if a break of a support or resistance levels has sufficient momentum to continue, or if the odds are the price will reverse below the broken level and start a trend in the opposite direction of the breakout.


For target and stop-loss setting, Rob uses a combination of the 62 EMA, the 200SMA and the famous 800 SMA. He also adds trendlines to the chart as additional support and resistance indicators. As for the MACD, instead of the standard 26, 12, 9 parameters, which in his opinion print too many divergences, he prefers the slower ones of 65, 30, 23.
Momentum Confirmation
And yet another way to measure divergences is the use of the MACD by setting the short term parameter to 3, the long term parameter to 10, and the smoothing parameter to 1. What it does is basically to subtract the 10-period Exponential Moving Average from the 3-period Exponential Moving Average (see Chapter B01 for more details on the MACD construction).
Bub Hunt calls this adaptive version of the MACD, the 3/10 Oscillator. What is most interesting in this approach is the distinction from a divergent condition and what the author calls a “Momentum Confirmation”. He explains:
When using the 3/10 Oscillator, we are attempting to identify one of two conditions on successive market swings that move to either new highs or to new lows. The first of these conditions is referred to as "Oscillator Divergence" and the second as "Momentum Confirmation". The two terms describe opposite conditions. Typically, each successively greater swing pivot high or swing pivot
low will be accompanied by one or the other.
[…]
In essence, the Oscillator Divergence indicates that the current market movement is losing momentum. It is at these times that a reversal is most likely. If we were considering a trade in the direction of the expected reversal, this would be an opportune time to initiate entry. On the other hand, when Momentum Confirmation occurs, we know that the current swing direction has some "oomph" left to it, and it would be best to either stay with the existing positions or look for an opportunity to climb on board.
When properly used, the 3/10 Oscillator can become a very helpful tool for the Active trader. It is a quick and effective means of measuring market momentum, revealing valuable information about the market's underlying intent. Become proficient in its use, but also realize that it is not infallible.
Candlesticks and Wyckoff
There is another piece of knowledge you can add to your charting techniques for the enhanced clarity of market sentiment that it provides: the Wyckoff “Candle Volume Analysis”, which Todd Krueger reveals in his article “Riding The Curves”. Wyckoff made many important discoveries in the field of technical analysis. Specifically, he explained how the interrelationship between price and volume can add information to follow the footprints of the smart money. Its sheer trade volume sizes create imbalances in the supply/demand equation which are, says Krueger, the true cause of price movements.
In Wyckoff’s trading days, he had no knowledge of this charting methodology or the enhanced clarity of market sentiment that it provides. The Wyckoff Candle Volume Analysis methodology greatly expands on Wyckoff’s original work and further enhances the ability of the properly trained chart reader to identify the very supply/demand imbalances that the markets move from.
The technique displays a combination of the Wyckoff Volume Analysis with candlesticks patterns (Chapter B04) by adding a volume histogram to the chart. Actual traded volume figures are not easy to obtain in the spot Forex markets. That is why a tick-based volume is used instead, which tracks the changes in price for a given time period.
The reason we picked this strategy is because it examines the same phenomenon as the “bull or bear trap” mentioned above.

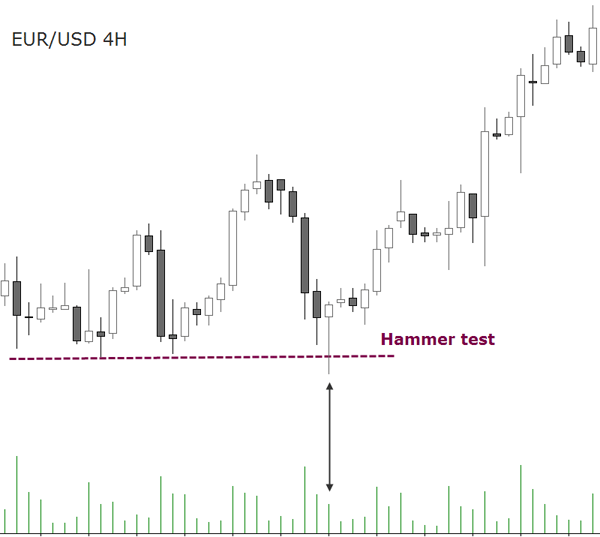
Do you see how the hammer’s lower shadow tests a support level by piercing it? This price action detects if more sellers will enter the market at lower levels below recent support. If there had been any latent supply, the exchange rate would have soared to new swing highs again. But since this test bar forms a near perfect hammer, in Wyckoff Candle Volume Analysis terminology it is called a “hammer test”.
The hammer test gives us two important signals: the first being a reduced volume compared with previous candles, and the second is the information which a hammer usually transmits with the price piercing the support level and coming back to close above it. If this happens with a reduced volume, it shows that there are no large interests of potential sellers to take the exchange rate lower.
Volume in Forex is often Tick Volume: it is actually a count of “ticks” received in a time period; it is not contracts traded, or monetary volume, or even necessarily a change in the trading price. In the Metatrader charting platform used for the above illustration, any change in the trading conditions for the pair is counted as a tick. Such changes can be, for instance, a change in the spread (in the bid and ask prices), changes in the the swap conditions, changes in the tick size in pips, or the pip value. For example, if you are trading EURJPY, and your deposit is in USD, then any change in USDJPY can adjust the “tick value” in EURJPY.


