3. Determining Support and Resistance
Reading The Order Flow With Candles
Candlestick charting should not be used in isolation to other analytical techniques. In this section, we will explpore some of the theories behind why support and resistance works so well in helping to fuel the movement of an exchange rate. You will see that candles are excellent for detecting trend reversals and continuations, especially near support and resistance levels.
To understand how we can use the candlesticks to know more about the supply and demand at any given moment, we will start by following a candlestick chart changing step by step and by seeing how candles are shaped. The reasoning behind why it works has a lot to do with what other traders are thinking as they enter, exit and hold a position.
1. In the chart below, we see the candle opens at 1,2500, and then quickly rallies to 1,2550. The reason the price moves higher can be a concentrated burst of buying activity despite the supply being kept constant. This imbalance helps fuel the exchange rate to rally to higher prices.
2. If demand keeps increasing and the supply disappears, the exchange rate will rise even more. This means there are many buyers and no sellers.
3. If the same number of buyers keep holding the pair, but the next group of sellers steps in to offer the pair, the exchange rate falls to close the session near its opening price and forms a first signal of demand exhaustion.
4. At this point, the traders who bought at a lower level realize that the pair is coming out of overbought and start to sell short in anticipation that the pair will pull back... which is indeed the case. When buyers cover their positions and decide to become sellers, the exchange rate falls even further.
5. At this lower level there is still a larger number of traders willing to buy at a better price. However, there is still a large number of die-hard sellers who delay covering their positions, in hopes that the exchange rate has reached an area of resistance, and will pull back again into a profitable territory. Now buyers and sellers equal in number again, that is, supply and demand are in equilibrium and as a result the exchange rate doesn't change. An indecision candle signal emerges.
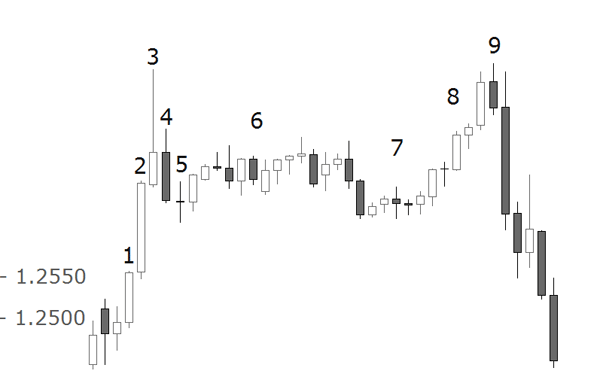
6. More sellers and buyers enter the market, and some of the traders who had open positions reverse their trade direction. Volume picks up considerably as everyone is buying and selling to each other, but what happens to the exchange rate? It remains in a range because there is no imbalance between buyers and sellers.
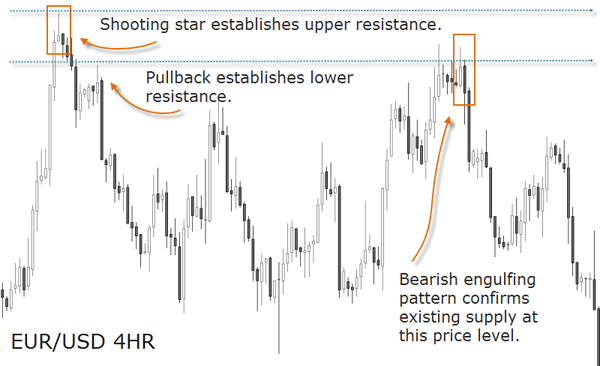
Suppose that you are a buyer who has bought the pair at the high of the shooting star, and because of your high tolerance for pain, you did not cover your position when the pair dropped. You still manage to be bull when price consolidates at (5). Even though you are in deep losing territory, you will not immediately cover your position hoping for a resuming of the trend to see the price passing the point where you first went short into profitable territory again. The question is, however, where will you cover if the pair does not continue to rise? The answer is that you will probably wait and see how the pair behaves around the area of consolidation. If it crashes through the low shadow of the candle (5) and continues to fall, you will quickly cover your position and cut your losses short. If the pair reverses and starts to climb, you will hold on to the position and rake in your profits at a higher price.
So as you can see, the consolidation range is a very important decision area and depending on the way the pair breaks out of it, it will be a future reference.
7. The process creating a lateral price movement will repeat itself until the traders start to loose interest in keeping their positions open for more time. Volume reduces on both sides and because the supply-demand equation is still balanced, the market is kept in a range.
8. Soon, one of the sides, let's say the sellers, gives up and covers positions and takes some profits. The buyers remain the same but as soon as no seller is left, the exchange rate starts to rally. Notice the rise is due to a reduction of supply, not because there are more buyers. Actual volume is now at its lowest.
At this stage, however, the astute candlestick reader will be able to observe the bullish trend at the left side of the chart, and deduce that buyer demand will be exhausted when the price reaches the recent hight at the top of the shooting star (3).
8. With price reaching a prior resistance zone, a whole flurry of astute sellers will step in in anticipation of a downside move. Even if the thin demand is kept the same, the exchange rate considerably falls forming a dark cloud cover. In face of this classical reversal pattern, traders who bought the exchange rate at this level will close their long positions because they now have finally conceded that they were wrong when they bought earlier. A dark cloud cover signals the exchange rate is now going lower, not higher. This explains how a prior price resistance can become again an area where supply exceeds demand: when a pair is rising and encounters resistance, traders will use that barrier either as a target to exit long positions, or as a starting point to enter short positions. The reverse often occurs when a support zone is tested.
So by observing the candlestick color and relative size and relative position, the astute candlestick reader is able to deduce what other traders are thinking, and estimate what is the most probable outcome in the future of the price.
You have probably noticed that during this analysis we have not mentioned any details about the pair that is being traded, if any news were affecting the price action, and we barely mentioned what the technical indicators were saying. The reason for this is because in short-term trading, the most important element is a good understanding of what the candles are transmitting about price behaviour. How indicators, of whatsoever nature, are interpreting that behaviour, is secondary to this exercise.
As shown in our example, the only element that will move an exchange rate higher is the willingness of a trader to buy it at a higher price. A currency can have rock solid fundamentals, but if no one is willing to exchange it for another currency, the exchange rate will not go up! The same when a pair is overbought for a long time accordingly to a technical indicator - if no buyer is willing to step in and buy the base currency, the pair will keep falling into deeper oversold territory.
This is why it is so important for short-term and swing traders to learn how to read the market through the eyes of other traders, not just through the eyes of a financial analyst. Candlesticks are a great way to methodically unravel the clues regarding market sentiment and order flow.
How many times has this situation happened to you: you enter a trade based on a bullish reversal signal, let's say a hammer, but then you exit on a slight pullback only too see the exchange rate rally to a new high after you exit.
Unfortunately, there is no system that can predict with a 100% accuracy where a greed rally or fear sell-off begins. There are however techniques based on candlestick patterns that help us locate probable areas for these turning points. The rest of this section will explore these techniques that can help you manage your risk.
Remember a basic principle: candle charting techniques are a tool of analysis, not a turn-key system by itself. These techniques demand not only an understanding of the intrinsic price action mechanisms, but a coherent trading approach based on sound rules as for tactics and money management.
Tails as Support and Resistance
The formation of one or more tails at, or close to, an area of support (bullish shadows) or resistance (bearish shadows) is fairly common. Experienced traders pay close attention to visible barriers on a chart and often execute trades near those points. Tails may form due to several reasons: an overextended market sentiment, an increase in volatility, or a shift in the supply and demand equation. Let's proceed with the first scenario.
The exchange rate is always creating new support and resistance zones. One of the ways a new S&R zone is created is when the market is overextended, that is, when it covers a large distance in a relatively short amount of time causing a short-term overbought (uptrend) or oversold (downtrend) condition. Out of this price action emerges a long shadowed candlestick.
After such a directional move, price often pulls back to the same zone where the supply or demand are located, thus offering a trade opportunity.
A shooting star, for example, is a bearish pattern that forms after a strong price advance. It has a long upper shadow and a small real body that forms at the lower range of the candlestick line. The large shadow is a signal of the strong imbalance towards supply that exists at the top of the candle.
Tails may also form during times of increased volatility in a certain pair. Long upper and/or lower shadows are a sign of significant intraday movement up and down.
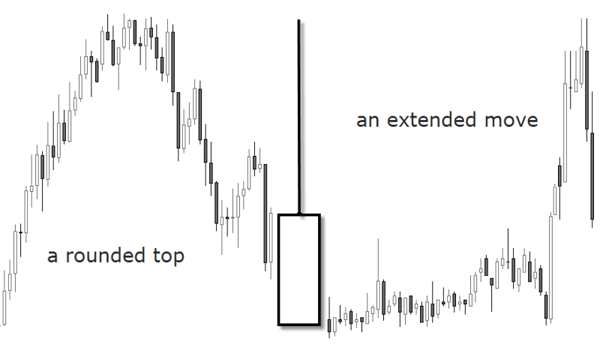
On a lower chart, the price action forming a long shadowed candle on a higher chart can look very differently. See the above illustration: on both sides of the candle different price movements are displayed. At the end, both printed the same candle, but the extended move on the right side shows a bigger supply-demand imbalance at the top end of the candle's shadow than the movement on the left side.
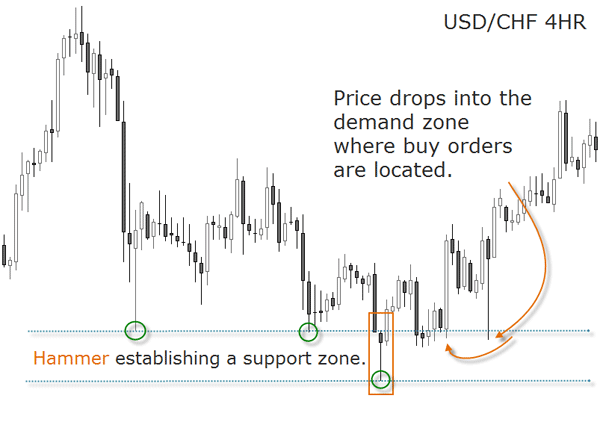
When you see a hammer emerging at a significant support level, notice how the price drops back to pierce the hammer's shadow. To get a low risk trade set-up, locate the stop below the bottom end of the hammer and target the next major resistance zone.
An ideal hammer should have a lower shadow at least twice as large as the real body. This brings objectivity to the interpretation of the signal. But if you see a hammer emerging after a downtrend and a lower shadow which is only one and a half times the real body height, but you also observe that the market is at a major support zone, then you can still view that as a classic hammer. As a general rule, the overall technical picture is more important than a single candlestick. That is why contextualizing candles is so important: it offers you a certain flexibility without loosing the edge.
Long shadows reveal a loss of control by the previously dominant group. Recognizing such can help with chart analysis and trade management. Price often changes direction, at least temporarily, after the formation of one or more long shadows. Swing traders can use these signals at their advantage to exit a position and/or take a trade in the opposite direction.
A doji that emerges after a trend should be viewed as a warning that the trend may be changing. It represents indecision, uncertainty, or vacillation by those who were sustaining the trend.
One powerful reversal signal is given when a doji pierces the high of the previous candle in the context of an uptrend. What the candle is alerting of is that, despite a rise in price, the buy orders where not enough to sustain the price higher. This is the same as saying that at the top of the doji, powerful sell orders were located. These orders attracted the price and were triggered when it got there. So, when watching a doji candlestick, pay close attention to the length of its shadows and especially to the shadow in the direction of the preceding trend.
The Risk to Reward
Candlestick signals alone should not be a reason enough to enter a trade. You must always consider the risk to reward ratio. Besides, not all signals will lead you to profits, hence the vital importance of managing risk or position sizing.
In order to calculate your risk to reward ratio, you start by locating your stops. Candlesticks offer well-defined guidelines for placing stops. Usually, the lower and higher end of a candle's range is a good stop-out level.
For example, the lower end of a bullish hammer can be used as a stop loss level if it is contextualized as a support area. When a hammer emerges, price rarely rallies from there, but instead it often comes back to touch the lower shadow. Therefore, stop loss orders shall be located under the bottom end of its shadow or below the range of the support area.
The same with a shooting start: its higher end can be used to place a stop loss order if the general context shows it is a resistance zone.
Candlestick patterns may also be used to trail the stops. For instance, a hammer emerging in the context of a larger uptrend correction, can be used to trail the initial stop on a buy order to a higher level.
The second step is to set price target. Candlestick signals indicate that a change in the direction of price may occur; however, they do not indicate how significant the change will be, or how long it will last. Candles are only powerful at confirming the force of the market at a support or resistance level in form of an early buy or sell signal. But as far as where to take profits, you have to locate prior major support and resistance zones. If you don’t have a price target, you don’t have a trade set-up.
To be a successful trader, you need to always know what the risk to reward ratio is, before entering the market.
At this stage, you might enhance the “trading checklist” from Practice Chapter A, adding the recognition of a valid candlestick pattern. Refer to that material to learn when a candlestick reversal pattern is not valid, despite complying with all the recognition criteria.
The third step is comparing, in each particular set-up, the amount of pips you risk and the potential amount of pips you can gain. The result ratio has to be always positive. The higher the potential gains compared to the pips at risk, the better is your risk to reward ratio.