4. East Meets West
A major advantage of candlestick charts is that, since they are made up of the same information as bars charts (that is, Open, High, Low, Close data), all of the western charting techniques can be integrated to reinforce the candle signals.
By the time the Japanese created the candlestick technique, it was probably powerful enough to be used as a single analytical method. But today most analysts agree that the best results are achieved when combined with western charting and technical analysis. We would recommend at least to take horizontal support and resistance levels into consideration as explained in the previous section. But you might also add technical indicators to your chart such as an oscillator or some moving averages for further confirmation.
There are surely a myriad of ways by which traders can use western tools in conjunction with candlesticks. We suggest you to continue using whatever indicators you like to use and confirm or filter the indicator's signals using the candles. The other way around is also possible: to filter or confirm reversal candlestick signals with the use of, let's say, MACD.
For example, if there is a bearish regular divergence in the MACD indicator, which means price made a new high, but the oscillator didn’t, and a bearish shooting star and a dark cloud cover emerge on the candle chart, that increases the likelihood of a market turn. For detailed information on how to trade with divergences, please refer to Chapter B01.
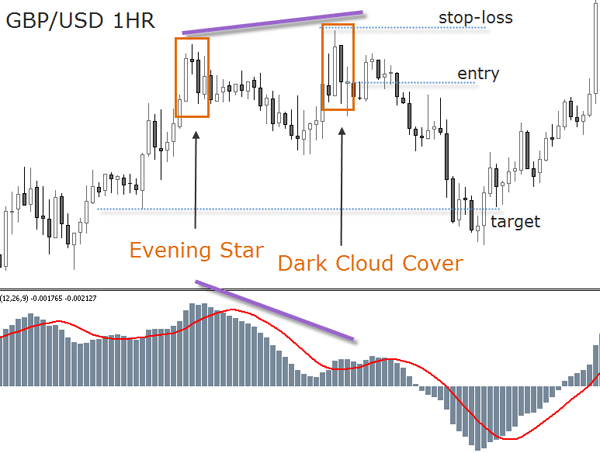
As seen in the above example, candle charts revealed reversal signals earlier than lagging indicators. By the way, MACD divergences are great, aren't they?
Although the MACD bearish cross happened at the same price level as the close of the bearish engulfing pattern, the technical indicator triggered the signal nine hours later. Candlesticks are not lagging indicators, they are a visual expression of price action!
Use our Candlestick Watch, by checking the “Currencies at a Glance” section at FXstreet.com. Once you have clicked on the currency pair of choice, go where it says “View (pair) Technical Studies”.
There is still another way to use signals provided by candlesticks: to exit positions. Imagine you are in an open trade and a reversal signal or a doji emerges. You might want to reduce the position size or exit completely in anticipation of a market turn against your initial position.
Don't focus on candlesticks alone. Trying to build a trading method exclusively based on candle signals will lead you to poor results. To interpret the meaning of the candle patterns in their main context is more important than recognizing the patterns themselves. In order to contextualize them properly and to build a trading methodology on that insight, additional resources are needed. This doesn't mean you have to plot 10 indicators on your chart - probably the use of one of them will be enough.
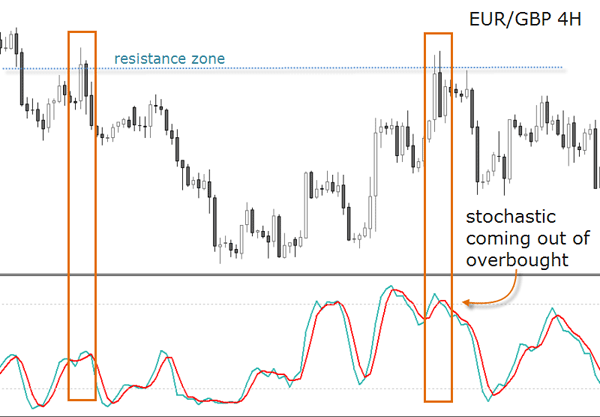
One way to increase the likelihood of a candle signal calling a reversal is to read an oscillator for overbought and oversold market conditions. The chart below illustrates a trade set-up using the Stochastic oscillator. The candlesticks printed two reversal signals at a resistance level. But while at the first candlestick signal the technical indicator was at 42%, the second time it was at 82% - that is to say overbought. This is a clear case where both tools converged at the same signal.
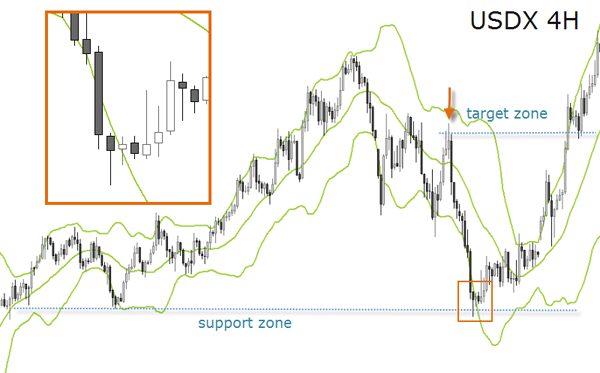
The use of Bollinger bands is also very compatible with the candlesticks because they are used to measure when the market reaches extreme price levels. The below set up shows the USD Index printing a hammer at a major support area. Notice also how the hammer candle is completely out of the lower band, adding more evidence that a change in the direction of price was about to occur.
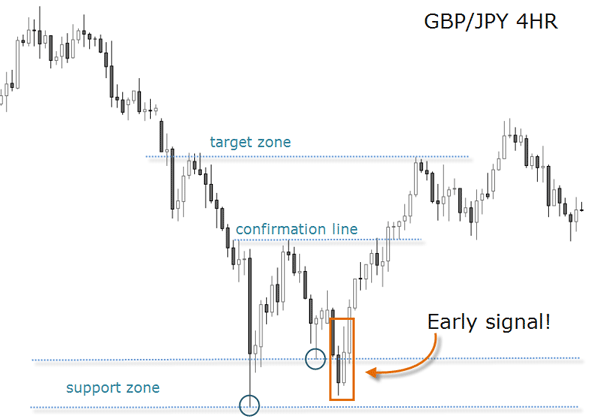
Yet, to enter the trade, this triple confirmation is not enough - what else is of vital importance? The answer is: the risk to reward ratio. The bearish engulfing pattern could have been used as a first target offering a good ratio.
Using charting techniques, you would have said a double-bottom was forming. But it took 32 hours for that chart formation to break through the confirmation line. The market printed the bullish candlestick pattern at the prior support zone, providing an early entry signal.
Candlestick charts can be a valuable asset to your trading arsenal. The question is not whether they work or not, the question is learning how to use them correctly. Feel free to share your candlestick charts and set-ups in the Forum. If each pattern is properly dissected and studied, the gathered information will become a powerful investment resource for the rest of your career.
This chapter has geared you with valuable analytical knowledge which, together with all the knowledge and insights provided along Unit B, has laid down a solid foundation for your career as a currency trader.
What you have learned from this chapter:
- Why the relationship between the real body and the shadows of candles is so important and how much information can be gathered here from.
- How to put candles in a context taking into account the knowledge from chapters B01, B02 and B03.
- An even better understanding of support and resistance by looking for daily and intraday candles and their signals.
- Western tools are necessary to contextualize the candle patterns, specially to set targets.
- The risk to reward ratio can be enhanced favorably when using candlestick signals.
FXstreet.com contents:
- Candlesticks and their whole picture by Tomas Cedavicius
- Basics Of Candlesticks by Geert De Boeck
- Introduction to Candlestick Patterns – Webinar recording by Andrei Pehar
- High-Probability Forex Pattern Trading – Webinar recording by James Chen
- Candlesticks and their whole picture by Tomas Cedavicius
- Basics Of Candlesticks by Geert De Bo
- Understanding The Creation Of Candles In Forex Trading – Webinar recording by Sam Seiden
- Using Candles to indentify entry points and risk by Pierre Charlebois
- Looking For Key Support and Resistance Using Candlesticks by Pierre Charlebois
External links:
- Candlecharts.com - Steve Nison's official website
- Candles shed light on the market - Interview with Steve Nison, Active Trader Magazine, 2003
- How to Use Candlesticks to Identify Support and Resistance, by Tina Logan, TradingMarkets.com
- Candlestickforum.com