3. Time Statistics
This section is about evaluation strictly from the standpoint of time. The use of time is essential to properly evaluate a trading system. This form of analysis can be used on the entire system or on its individual trades. In either case, time-in-the-market is considered a measure of risk. Time statistics are important because the longer a position is exposed to the market, the more risk it assumes.
Average Holding Time
This is an important statistic because in Forex there are roll-over gains and losses associated with the time duration of trades.
Average Time Holding Winning Trades versus Losing Trades
A variation of the above figure is the Average Time Holding Winning Trades versus Losing Trades. At first glance, this figure may not seem useful, but including it in your arsenal may lead you to collect some valuable information. There are traders that after the years perform better in long than in short trades, or vice versa. A myriad of other aspects can cause your system to perform better in one side than the other. If you don't track this number, it's much more difficult to detect any irregularity.
Longest Total Equity Drawdown
It's a series of losses measured from a previous equity curve peak to new equity peak, expressed in time. Its usefulness relies on the fact that the trader knows what to expect in terms of losing strings and adapts risk control measures in order to endure a large Drawdown.
Maximum Monthly Total Equity Drawndown
Like Maximum Drawdown, this is also a one-time event that reflects the largest retracement in the equity curve relative to a previous equity high, but based on a month-end to month-end and Mark-to-Market. Usually expressed as a percentage, this figure is important especially for institutional traders who are subject to rigorous monthly revisions and risk control measures.
What does Mark-to-Market mean? Mark-to-Market is a term used by institutional traders for closing the books at a certain time. If a Mark-to-Market is performed on a monthly basis, for example, it means the account is officially closed at the end of each month - similar to receiving an account statement from your broker with a bottom line on all open and closed positions. Institutional traders, especially position traders, need a Mark-to-Market report to allocate profits or losses. Take for example a single trade that makes 30% Return Rate and that begins on September 1st and closes on January 15th of the next year. What the Mark-to-Market report does is to assign the proper percentages to each month instead of the entire amount at the end of the period. Some strategies, where individual trades may run for extended periods of time, need to have such a thoroughly and complete evaluation.
Trades per Day/Month/Year
This figure is related to the Trade Frequency and is important to evaluate more sophisticated figures. For instance, in a system with ten trades per year, the trading costs are less important, but the Win Rate becomes crucial. The higher your trading frequency, the smaller your chances of having a losing month. If you have a trading strategy that has a winning percentage of 70%, but only produces one trade per month, then one loser is enough to have a losing month.
But if your trading strategy produces five trades per week, then you have on average 20 trades per month. With a Win rate of 70%, your chances of a winning month are extremely high. And that's the goal of all day-traders: having as many winning months as possible!
A variation of this figure may point to the amount of winning or losing trades per day/month etc.
So, the question “How long should a performance report be?” mainly depends
on the trade frequency. If your strategy generates three trades per day, then you might get enough data after several weeks of trading. But if your trading
strategy generates only three trades per month, then you should perform your strategy for several years to receive reliable data results.
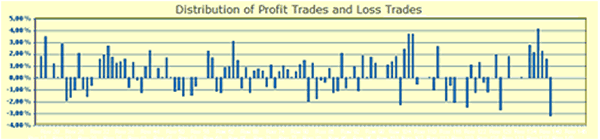
When displayed in a chart, the distribution of trades becomes an important data. As a trader you want to know if your system is producing winning trades in the same average rage it has been doing in the past of if there are any changes. It can also give you clues as if there are days in the week when more winning or losing trades happen, etc.
The below chart displays the distribution of trades corresponding to the equity curve displayed in the first section.
A lot of statistical figures have been covered so far. While back or forwardtesting your trading strategy, you should keep detailed records of
all these data - or at least the majority of them - in order to produce a significant performance report. Many software packages can help you with that, but a simple excel sheet will do the trick just as well.
Because the potential gains in Forex are so big, the excitement of a unparalleled lifestyle and the freedom of choice associated to trading might easily cloud our objectivity regarding our abilities and limitations. Statistics help you see the trading without this emotional attachment and build your career on more realistic expectations.
An aspiring trader can make money trading over a short period of time with a little luck, but specially when starting out you need to measure your expectations with a proper goal setting. Your goals must be in synchrony with where you are in the learning curve. If you have a goal of doubling your account in a few trades, you probably need to concentrate on not blowing up the account overnight.
The next section will help you to come off the individual results from each trade and look at the overall statistical landscape.