4.Time Frames: A Matter Of Scope
There is an old saying which states that "Time is nature's way of making sure everything doesn't happen at once". Regardless of whether you are measuring a trend in a one minute time frame or observing a major pullback on the daily chart, the same indicators and techniques can be applied. It all comes back to behavior patterns which are not time frame dependent. It is just a matter of scope.
At any time the market is filled with participants who have different opinions of which way the market shall be moving. One of the reasons they sustain different beliefs about what price could be doing next is probably derived from the time frame they are looking at and intercating with. A trader who looks at daily charts may think an uptrend is in process, while a trader who looks at a 60 minute chart may think the market is trending down. The fact is that they may both be right in their analysis. So when it comes to discussing a trading opportunity, the goal is not to find out who is right, but rather understanding where the technical argument comes from.
Time frames: Correspondences Between Moving Averages
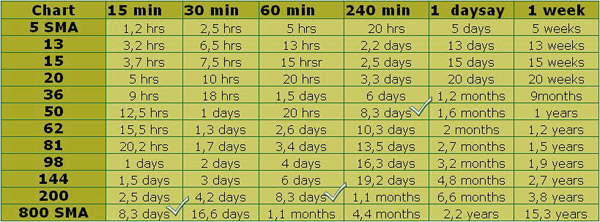
One of the biggest reasons why so many traders, especially those with a short-term time horizon, flock to technical analysis is the synchronism between indicators displayed across different time frames. The table below shows several simple moving averages and their correspondence across different time frames.
The 800 SMA, for instance, corresponds to the 200 SMA on a 60 minute chart and to the 50 SMA on a 240 minute chart.
Working with several time frames simultaneously requires some sort of guidelines. Here are some of them listed:
1. Each time frame displays its own technical structure.
2. On less liquid pairs, shorter-term movements tend to clutter the picture as they may contain more noise. Apparent chaos on a small time frame can be a clear defined pattern on a higher time scale.
3. Daily, weekly and monthly charts better suit for identifying longer-term trends and patterns.
If you plan to trade around a day job?, check out the longer term charts at Ryan Okeefe's blog. Ryan is great at finding S&R levels on charts and provides you with clean and entertaining chart interpretations. His motto: 'When it's not obvious, it's not a trade.'
4. Shorter time frames usually respect technical levels from the higher time frames.
5. S&R levels from higher time frames prevail over those on lower time scales.
6. A higher time frame should be used to obtain a panoramic view while the lower one to apply the tactics.
An extract from James Chen's blog about using 3 time frames simultaneously says:
While the market is still essentially in consolidation mode, I thought I would bring up what I consider to be one of the highest-probability technical approaches to Forex trading. Many of you may be familiar with it. First originated by Dr. Alexander Elder in his book, Trading for a Living (John Wiley & Sons, 1993), the Triple Screen is a simple but ingenious multiple time frame approach.
To trade the Triple Screen, you would begin with your favorite time frame, and call it the intermediate chart. Multiply that time frame by 4-to-6 times to get the long-term chart, and divide it by 4-to-6 to get the short-term chart. So for example, if you usually trade the 4-hour as your intermediate, you may choose the daily as your long-term and the 1-hour as your short-term.
On the long-term chart, which is your first screen, you would use trend-following indicators like moving averages, MACD, trendlines, etc., to decide whether to go long, sell short, or stay out of trading altogether due to a lack of trend.
On the intermediate chart, which is your second screen, you would use oscillators (Stochastics, RSI, etc.) to identify a likely pullback entry zone.
And on the short-term chart, which is the third screen, you might look for support/resistance breakouts in the direction of your planned trade to actually pinpoint the trade entry.
In sum, the Triple Screen is a classic technical methodology that, with practice and experience, can potentially contribute significantly to your trading approach.
From the same author, James Chen, you can watch a recorded webinar on the subject of Multiple Timeframe Trading.
Regarding timing, what are the best times of the day to trade certain pairs?
For example GBP/JPY can have tremendous moves during the Asian session, but it's hard for traders located outside the Asian zone to keep up and profit from it. Nevertheless, it keeps moving with its typical volatility around the clock.
In turn, the EUR/USD and the GBP/USD offer nice technical set-ups right at the start of the Frankfurt and London markets which often sets the tone for the rest of the day. These pairs very often display continuation moves, the so-called 'second-legs', during the morning session in New York when both sessions, the European and the American, overlap and many US Dollar related economical news are published.
The reason why we see big moves at the London open is because London is the world's capital of Forex trading, and when those big traders start throwing their weight around, the market responds with volatility. Also U.K. economic indicators are often released at that time of the day, contributing to the overall climate of high volume and volatility.
Regarding what time frame would be the best to trade... if the answer were a particular time frame, the whole world would probably trade accordingly.
To begin with, it must be clear that although observed through different time scales the price series is the same, and going to lower time frames is like zooming our perspective of the price action.
For the purposes of orientation and interpretation, the choice of a distant or close vision responds to very similar criteria to those we use in our day-to-day lives: if you walk down the street looking to the ground, it's easy we run into a lamppost, while if we only look on the horizon we can stumble upon anything on the floor. It is clear that we must keep a global overview while observing the detail at the same time.
In trading, as in other professions, there is a time scale we use to analyze and a time scale we act upon. The later corresponds to the distance that helps us work better. A computer programmer has a shorter distance in his work place than a taxi driver who has a larger visual field. Also traders make a predominant use of a certain distance to price action accordingly to their trading style.
Depending on their goals traders will act in a certain time scale and this will be their time frame to trade. They may detect trading opportunities in a large time frame, and effectively trade in a shorter time frame where they better manage the risk of position. Obviously, there should be a reasonable relationship between the two time frames, between the potential area to capitalize on the bigger chart and the terrain used to trade on the smaller chart. Analzing the biiger picture on the daily and execute the trades on the 5 minute is probably too big of a distance.
Determining how far you need to zoom in the charts depends on your trading approach. You can start answering yourself some questions:
- How do I adapt to a 24 hour market?
- Am I available (or do I need) to pay attention to the market at peak hours?
- Does my strategy requires to pick exact entriy poins or are entries not so price sensitive?
- Does my strategy requires me to be in front of the charts for long periods?
Therefore, the time frame you choose to work with should reflect the trading concept you're looking for. It should not be too large, to avoid losing too many opportunities, nor too short because of the higher swipsaws within small time frames. The smaller the time scale is, the more random behavior price action shows. Besides, it's easy to lose track of what is happening if you do not keep an eye on large charts.
There are many traders who indeed use very small time frames, but what most of them do is to use small charts to define entry and exit points to manage the positions, while the opportunities have been spotted in larger time frames. Except in some cases, the majority of the so-called 'scalpers' do not exclusively rely on small time frames.
Ultimately, what is intended by combining large and small charts, is to reduce the impact of randomness and improve the trading edges. It cannot be emphasized enough that trading without an edge is the same as throwing a coin to decide in which direction to trade.
We have come to the end of this chapter. Now that we have covered price action and technical methods, in the next chapter we will move forward exploring the fundamental factors which move the markets, the third part of the market analysis triangle. At that point you can decide for yourself whether you would like to base you trading on price action alone, support it with technical analysis, work with fundamentals, or a combination of the three.
One thing you can do straight away is visit our forum to find out if there are traders with similar resources as you, i.e. same available times to trade, similar technical tools, even similar manners to combine technical tools, and find out what is working for them and share your point of view too!
What you have learned from this chapter:
- Technical analysis can be effectively and safely employed if combined with price action analysis.
- Each trading opportunity, like any other risk-taking venture, requires a thorough understanding of both the application of the methods and the risks involved.
- Technical indicators can be used to generate buy and sell signals, but they can also be used to filter out false signals.
- Correspondences among different time frames and the matching of several indicators at one level confirms the importance of that price.
- The use of different time frames is a reasonable approach, but it requires some previous considerations.
FXstreet.com contents:
- Trading with moving averages by Valera Bednarik.
- Perceiving Forex Volatility via Descriptive Statistics: Deriving Trending and Reversals - Part 2 by Mark Whistler
- It's All Relative by Brandon Wendell
- Using Fibonacci to determinate market goals- Part I by Facundo Molina
- Using Fibonacci to determinate market goals - Part II by Facundo Molina
- Pivot Points in Forex by Raul Lopez
- A Practical Guide to Technical Indicators; Part 1 'Moving Averages' by S.A Ghafari
- Forex, schaff & manual indicators by Doug Schaff
- Trading Changes in Forex Volatility, by James Chen
- Trading Divergences in the Forex Market (Book Excerpt) by James Chen
- Forex Oscillator Trading by James Chen
- Forex Profit Targets by James Chen
- Forex Range Trading by James Chen
- Paralysis by Analysis by James Chen
- Bollinger Bands and Bandwidth by James Chen
- How I Use Stochastics by James Chen
- Trading Divergences in Forex by James Chen
- Average Directional Index (ADX) by James Chen
- Average True Range (ATR) by James Chen
- Stochastics Oscillator by James Chen
- Parabolic SAR by James Chen
- Price-Oscillator Divergence by James Chen
- Technical Trading Strategist in the short and longer term by Valeria Bednarik
- Multi-time frames for entry and exit signals in Forex by Peter Leonidou
- Catching Redfish off the pool: Trend Lines and Technical Indicators by S.A. Ghafari
- Institutional Trading Strategies: Pivot Points - Webinar Recording by Andrei Pehar
- Institutional Trading Strategies: The ABCs of Fibonacci - Webinar Recording by Andrei Pehar
- Advanced Forex Trading: Momentum Versus Reversals Within Indicators - Webinar Recording by Mark Whistler
- Tell me the Fibonacci ratios don't work - Harmonic Patterns - Webinar Recording by Sunil Mangwani
- Bollinger Bands and RSI - Webinar Recording by Valeria Bednarik
- Trading set ups when breakouts aren't an option - Fibonacci trades - Webinar Recording by Phil Newton
- Institutional Trading Strategies: The Indicators - Webinar Recording by Andrei Pehar
- Understand & Use Fibonacci Ratio's Effectively - Webinar Recording by Sunil Mangwani
- Multiple Timeframe Trading - Webinar Recording by James Chen
- Understand & Use Fibonacci Ratio's Effectively - Webinar Recording by Sunil Mangwani
- Reversals with indicators - Webinar Recording Sam Seiden
- Technical Analysis Bootcamp: The indicators you need to know and how to interpret them - Webinar Recording by Dan Blystone
- Using Fibonacci levels to project price targets and timing - Webinar Recording by John Jagerson
- Trading with Bollinger Bands and the ATR - Webinar Recording by Chris Capre
- Trading Forex on a Daily Basis Using Daily Charts - Webinar Recording by James Chen
- Fibonacci retracements and the Elliot Wave concept - Q&A Transcripts by Joseph Trevisani
- Using maths, statistics and market memory for simple and effective trading - Q&A Transcripts by Valeria Bednarik
- Using Moving Average in Trading - Q&A Transcripts by Valeria Bednarik
- Different methods for calculating pivot points - Q&A Transcriptsby Dan Johnson
- 'How to Become a Thriving Trader?' Series: Part II The Art & Science Pivot Point Trading - Q&A Transcripts by Robert Nowak
- How to incorporate MACD into your trading strategy - Q&A Transcripts by John S. Alesia
- Using the 62 Exponential Moving Average in Currency Trading - Q&A Transcripts by Rob Booker
- The World of Forex Breakout Trading - Webinar Recording by James Chen
External Links:
- Moving Average, ForexForum.net
- Intermediate Forex Analysis Tools, Informedtrades.com
- How to read the MACD?, Autotradingfx.com
- Technical Analysis, CMEGroup.com
- How to Read a Chart & Act Effectively, ForexQuestions.com
- Understanding Technical Analysis, FXDD.com
- Tales From The Trenches: Trading Divergences In FX, by James Chen, Investopedia.com
- Using Oscillators to get a feel for the market, FinancialMarketFisherman.com