3.Price Action Supported by Technicals
Let's start this section with a quick reminder of a previous lesson from Unit A : support and resistance levels are those levels where the exchange rate experiences upward or downward pressure. A support level is usually a low point in any displayed chart pattern, whereas a resistance level is a peak point in the chart. These points are identified as support and resistance when they show a tendency to reappear. Support and resistance zones work the same way in a trending market than in a range bound market.
Once these levels are broken, they tend to become the opposite obstacle. Thus, in a rising market, a resistance level that is broken could serve as a support for the upward trend; whereas in a falling market, once a support level is broken, it could turn into a resistance.
Before we go on with technical indicators, we have to keep in mind that most technical indicators boil down to price, as they are simply an equation or formula that is applied to the price.
A moving average is a good example, as it consists of the average - or mean price - of a trading vehicle over a designated period of time. Oscillators, such as stochastic or RSI, measure the difference between the current price and recent prices to determine if a currency pair is overbought or oversold.
Price information is thus of utmost importance for traders because unlike most indicators, support and resistance levels tell us where the buyers and sellers have set up camp. Remember: many of the large market players, like hedge funds and market maker banks, forecast price movements and plan their positions by looking primarily at raw market-generated data, that is, price action.
To know whether the supply or demand is growing or is being depleted, a trader can support price action analysis with a visual evidence derived from technical indicators. Facundo Molina emphasizes on this fruitful combination:
Many traders look at technical indicators for clues as to where price action will be moving in the future.
There are many problems associated with this approach. First and foremost, technical indicators lag current price. The indicators are created from data that is compiled from where price has been at some point in the past, the rate at which it is changing, and perhaps use volume as an additional filter. Technical indicators are simply a mathematical way of analyzing and representing price action and offering a different perspective of what price is doing. A trader should never rely exclusively on an indicator for a buy or sell signal. However, when used in conjunction with price behavior analysis, a trader can gain confidence for entries and exits as well as identify opportunities as they appear. Technical indicators should be used as a decision support tool.
There are many uses of indicators that serve as means to confirm and fine tune signals coming from evidence of price action. Let's see some ways of measuring the strength of supply and demand with the help of technical indicators.
Oscillators and price action
Consider the price action sequence in the graph below in which we rely on the RSI to get a sell signal. The downtrend hits an already existing support level and stagnates for a while. Finally demand is exhausted and supply gains ground, leading to a breakout at point 1.
However, during the consolidation phase, the RSI was most of the time below the 50% level (and even went below the oversold level at 30%). Thereafter a breakout occurs followed by a return to the former support area which, once broken, remember, turned into a resistance.
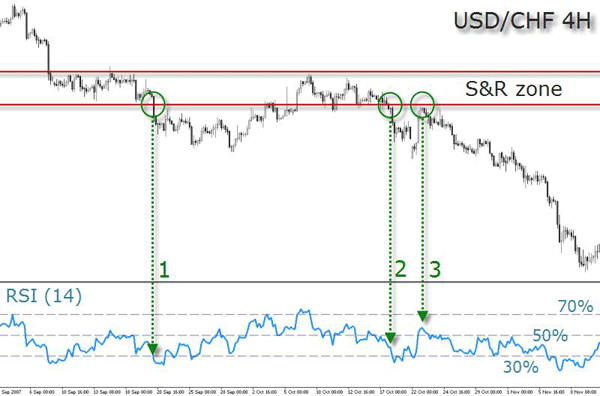
When price breaks down for the second time at point 2, the RSI is much closer to the 50% territory, having actually exceeded the overbought level of 70%. If the price has not been able to break the resistance level during the overbought condition, then we can conclude that the demand was low comparatively to the supply.
As usual, when price records a breakout, a pullback follows. In this 4H time frame the dimension of the pullback is almost of 200 PIPs and takes 3 days to form. Only then, the bearish trend resumes its course. The pullback at point 3 indicates the best entry, when the RSI turns slightly above the level 50 to revert back down immediately towards negative territory.
Making use of RSI combined with the identification of pullbacks, you'll see that level 50% is the most decisive. To use it effectively, wait until the breakout occurs. Only thereafter, you can follow the RSI and expect it to make the same pullback movement along with price action. If the price does not register a pullback then simply wait for the next opportunity.
The chart below displays the same situation using the Stochastic. In this case, the indicator provides an even more precise reading: in the first two breakouts, the oscillator shows some fatigue, while after the pullback the oscillator returns, full of strength, from overbought territory.
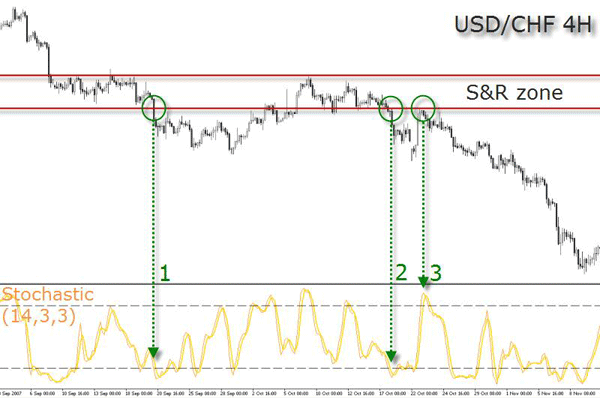
By means of these two examples, you've seen that the main signal was obtained from the price action first. Breakouts, and especially the pullbacks, are very reliable prints of low risk trading opportunities.
This emphasizes the importance of the price action to obtain the first evidence of what is happening in the market, and categorizes the indicators as a support tool to confirm what is already visible on the chart. Oscillators, in this case, can be used to confirm breakouts because they measure the strength of supply and demand.
When developing a trading method, it's important to think of all the arguments at disposal, whether these are given by trendlines, candle patterns or technical indicators. When confronted with contradictions, you must simply wait for these contradictions to disappear.
If, for instance, the oscillator shows an overbought condition, and price reaches a support level (remember: support means demand), then be careful! It could be a trap, and support may not work. Analytical tools must be used in unison with price action.
Sam Seiden points the hidden danger of giving priority to the indicator's signal.
Understand that the movement in price in any and all free markets is a function of the pure laws and principles of supply and demand. Opportunity exists when this simple and straight forward relationship is out of balance, period. What most people don't understand is that when you ignore a governing dynamic that has been around longer than man has walked the earth, you are almost guaranteed a losing trading strategy. You can spend a lifetime attempting to come up with the perfect set of indicators and oscillators with the perfect set of inputs with hopes of attaining all the worlds' wealth and get nowhere.
There is a reason for this which is the one thing you need to know about indicators and oscillators: They have NO IDEA there is an ongoing supply and demand relationship at work every second in every market at every price level. They are simple math calculations derived from price. Most are averages of price which means they lag price. Any indicator that lags price adds risk and decreases profit margins in your trading which is not ideal. Don't get the wrong idea, this is not another article beating up the indicators. My goal is to expose the flaws associated with using them and also show you a very astute way to use them in all your trading.
As a trader, you can read dozens of books on technical analysis and have several indicators plotted to your charts and yet still end basically break-even (or worse) at the end of the month.
The vast majority of aspiring traders don't approach technical analysis in a way that works. To a large degree, this is not their fault because most have been taught to prioritize technical indicators instead of price action.
No indicator will reveal completely what the market is doing. But there is something you can do to avoid entering trades based solely on technical indicators: use your judgment. You are not a robot and you will never become one. The better you learn to optimize that judgment through simplicity, practice and record keeping, the better the results will be. Preferably, settle on a strategy (a set of trading tactics) that suits your personality and thinking patterns. But first, start by observing price, and confirm its actions with one or two technical indicators that you understand well.
James Chen invokes a similar approach on how to use S&R levels in conjunction with technical indicators:
The most tradable ranges are bounded by two horizontal lines (but they can also be slightly-sloped parallel lines), and have enough height in pips to make trading them worthwhile from a risk:reward perspective. Usually, two approximately equal touches of a price level on top and two alternating touches of a price level on the bottom create a potentially tradable range. Sometimes, though, traders may anticipate a range by just waiting for two touches of a top/bottom and only one touch on the other side of the range.
Within a horizontal range, traders will often draw diagonal intra-range trend lines, and then trade breakouts/breakdowns of these trendlines. This can be one of the most advantageous methods of range trading. Although it gets the trader in a bit late on the turn, it provides a higher probability confirmation that the turn indeed took place. Beyond the intra-range trendline breaks, range traders will also use oscillators (like Stochastics, RSI, CCI, or similar) to confirm overbought/oversold conditions, and therefore possible impending turns.
When the forex market is experiencing prolonged ranging conditions, which it often does, range trading can be the most logical approach to tackling the currency markets.
The use of too many technical indicators is an often underestimated peril when applying technical analysis. When you accumulate to many indicators on a price chart, you lose simplicity. Because technical indicators abound and are so readily at hand through charting platforms, unprepared traders often gravitate to them as the easy solution for their trading. The first experience of knowledge and control can quickly change into a paralysis. This can actually be a major inconvenient in the use of an otherwise useful tool.
If you apply technical indicators knowing that they are mere representations of price action, but not price action itself, you will focus on making better trades. Moving averages are a representation of price and they don't exist anywhere else than on the chart. Van K. Tharp refers to these informational short cuts, or heuristics, as something useful under most circumstances, but with strong implications for traders. One of them is what he calls the 'representation bias':
People assume that when something is supposed to represent something, that it really is what it is supposed to represent. Thus, we assume that the daily bar chart is the market or that our favorite indicator is the market. Instead, we need to keep in mind that the representation is just a short cut for presenting a lot of information, or even worse, a distortion of that information.
Another of these implications, the author explains, is
.. our attempt to make order out of the market and find reasons for everything. This attempt to find order tends to block our ability to go with the flow of the markets because we see what we expect to see rather than what is really happening.
Source: "Trade Your Way to Financial Freedom" by Van K. Tharp, McGraw-Hill, 2007, p.44-45
Moving averages combined
The location of the price relatively to the moving average can be used to identify the trend. If the price is above the moving average(s), the trend is considered to be up. If the price is below the moving average(s), the trend is considered down. This is a pretty straightforward technique.
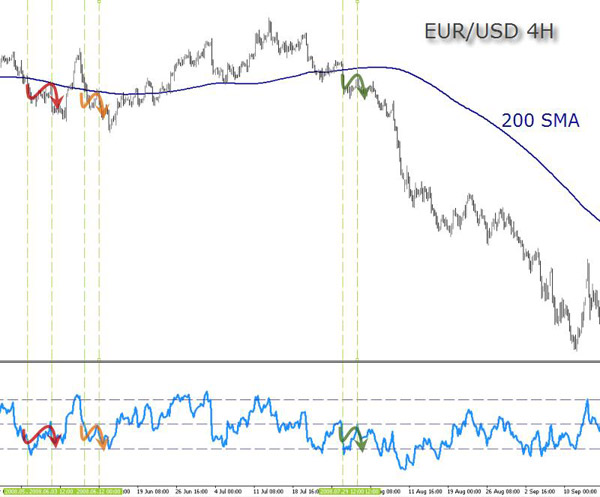
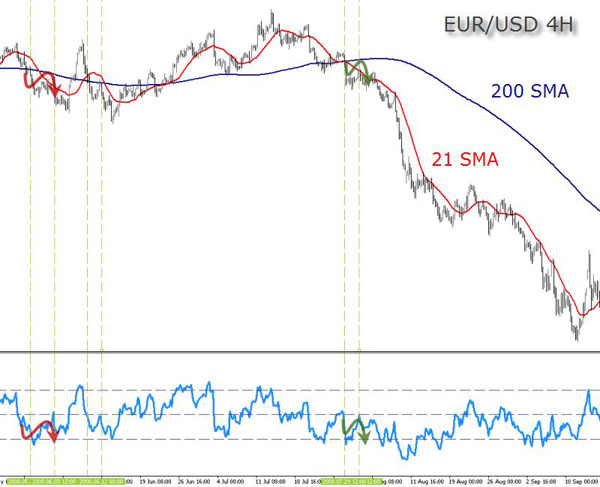
The following EUR/USD chart shows that buy and sell signals could be generated by crosses above and below the moving average. But that would be too simplistic. Let's filter out some signals with the RSI oscillator. In the example below the goal was to find breakouts of the 200 simple moving average, confirmed by pullbacks. The RSI confirmed those pullbacks by retracing to its 50% line. The first two breakouts of the SMA were short-lived, but the third was a clear winner. All the breakouts which were not confirmed by price action and sustained by the RSI were simply ignored.
Another technique for trend identification is based on the location of the shorter moving average in relation with to the longer moving average. If the shorter moving average is above the longer moving average, the trend is considered up. If the shorter moving average is below the longer moving average, the trend is considered down. In the example below, the 21 SMA acted as a filter reducing the number of signals from 3 to 2.
487
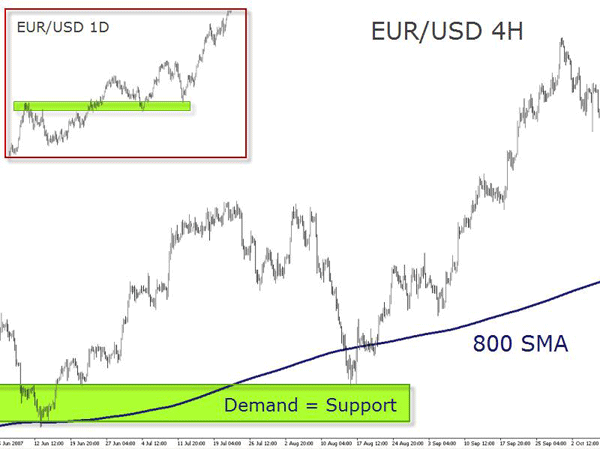
The classical uses of moving averages need to be carefully considered: moving averages are trend following indicators. However, currency pairs spend a great deal of time in trading ranges, which can render moving averages ineffective if only used to identify trends. This is not a problem though, then there is another reason why moving averages are widely used indicators: they behave very well as support and resistance levels. Geared with the expanded knowledge on S&R from chapter 4 in Unit A, you will now better understand this dynamics.
This is usually accomplished by identifying past S&R levels and match them with the current moving average location. The 800 period simple moving average may seem very static on any chart - but still it acts very well as S&R.
In the illustration below, the pair tested the 800 simple moving average support before breaking out. Therefore, the moving average acted as a confirmation of resistance-turned-support. The break of the support made by the moving average would serve as a warning that the pair may resume the trend.
Moving averages can be effective tools to identify and confirm trend, identify support and resistance levels, and develop trading strategies based on the collected ideas. However, traders should learn to identify which pairs suit to which moving averages. Usually, a visual examination of the price chart is a good way to start, although later it will require a more detailed approach.
As with most tools of technical analysis, moving averages should not be used on their own, but in conjunction with other tools that complement them. Using moving averages to confirm other indicators and analysis can greatly enhance your technical analysis skills. About this alignment of indicators Robert Nowak writes:
One interesting phenomenon that we have noticed is that the pivot tend to align themselves with the 10, 20 50, & 200 period exponential moving averages at various points on 4 hour and daily compression. In addition, the pivot and the moving averages seem to correlate strongly to 'classic' support and resistance levels-that is support and resistance drawn on closing prices. When we see a pivot and a 20, 50 or 200 period moving average aligned together, we will generally regard this as a very strong line of support or resistance. Thus, we would get into the market on a 'bounce' or reversal from that pivot. This is by far the safest way to trade pivots as you have identifiable support and resistance.
Matching Pivot Points with other tools
Here are some concepts you may use as a first approach to build a trading system based on pivot points:
1. The London session is still the most liquid of all sessions traded, specially during its start and during the overlap period with the start of the New York session. You want to calculate your pivots points using the GMT session high, low and close. Why? Much like any Support or Resistance level created during a high liquid session, the highs and lows of the day are more significant during these hours.
2. Just like all traditional S&R price levels, the pivot levels can reverse roles also. An old resistance can turn into a new support once it is violated, and vice versa.
3. You can also use indicators (Bollinger Bands, Stochastics, RSI, Commodity Channel Index etc.) to time your entries around these levels. A very useful print is the 161,8% extension of the Fibonacci tool: when this level matches with one of the S&R pivot levels, price is likely to be attracted by this confluence. This is specially helpful for breakout trades making them much more effective. Pivot points act as veritable price magnets for the next day's trading.
4. Pivot points can also be used on weekly and monthly charts to get a perspective of where price is trading in reference to the previous week's or month's price range.
5. Any long term pivot point (weekly and monthly) which has not been touched by price for a large period of time gains attractiveness as a target level for counter trend moves. So if you don't feel comfortable with all the trend following techniques mentioned, this one is for you.
6. On high volatile market conditions, a break of the first support or resistance pivot level will mostly lead to a move to the next level (S2 and R2 respectively). This phenomenon is observed in pairs with higher volatility as well.
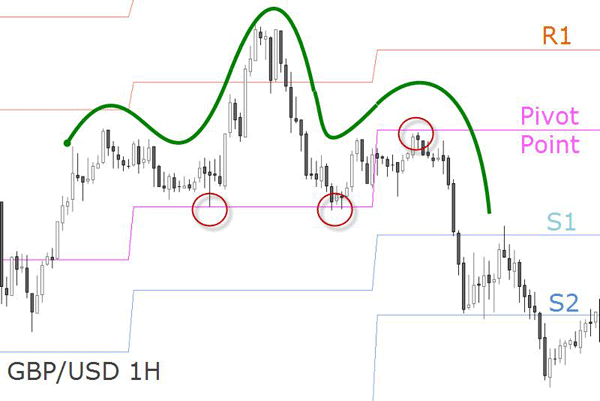
The chart above illustrates a head and shoulders pattern guided by the daily pivot point and its associated S&R levels.
Don't forget pivots when trading intraday as they are areas of support and resistance calculated from the previous day's high, low, open and close. The true value of pivot numbers is that they are heavily followed. So when you look at a widely traded currency pair, price will bounce, consolidate, and break around pivot points. Here is an excellent pivot point calculator.