3. Trends, pullbacks, breakouts, ranges: how the market expresses itself
Support And Resistance Zones
If you already started to draw a few S&R lines on your charts and see live how price reacts to them, you probably noticed these tools are far from being accurate: they constantly migrate a few pips up and down, they get pierced by price, and even some times price crosses the lines back and forth as if there was no line at all!
Let's face reality: lines only exist on your chart, there is no hidden place in the interbank market where lines are fabricated. They are just a tool to interpret price action and does not pretend to be more than that. What happens is that novice traders often confound reality with interpretation and expect price to respect and interact with a S&R level in a certain way.
Mark Douglas, in is book "Trading In The Zone" makes an important point about price action and trader's beliefs systems. When looking at price action, he explains, as a function of traders who are willing to bid prices up or offer them lower, then we can say that any price action is a function of what traders believe about the future. In other words, any price movement is a function of what individual traders believe about what is high and what is low.
The underlying dynamics of price action could be resumed saying that only three primary forces exist in any market: traders who believe the price is low, traders who believe the price is high, and traders who are watching and waiting to make up their minds about whether the price is low or high. Technically, the third group constitutes a potential force.
Following Douglas's argument, the reasons why traders believe a price is high or low are usually irrelevant. Moreover, you don't need to know the reasons as they wouldn't necessary help you gain a better understanding of what is going on in the market. Instead, as a trader you should take into consideration that any price action (or lack of action) is a function of the relative imbalance between traders who believe the price is too low and traders who believe the price is too high. As long as there is an imbalance, prices will move in the direction of the greater force. Conversely, if the two groups are balanced, prices will stagnate, because each group will absorb the force of the other group's actions. In words of the author:
When we look at the market from this perspective, it's easy to see that every potential trader who is willing to express his belief about the future becomes a market variable. On a more personal level, this means that it only takes one other trader, anywhere in the world, to negate the positive potential of your trade. Put another way, it takes only one other trader to negate what you believe about what is high or what is low. That's all, only one!
Source: “Trading In The Zone” by Mark Douglas, Prentice Hall Press, 2001, p.94-95
Price Zones
Don't be disappointed if S&R lines haven't worked for you until now. You see, in reality, support and resistance are price zones, not exact numbers. This is clearly visible when switching from a higher timeframe to a lower one: an horizontal line on a weekly chart can perfectly be made by an horizontal price channel on a one hour chart.
This is why it often what appears to be a break of a support or resistance level is just the market testing it. These 'tests' of support and resistance are usually represented by the candlestick shadows piercing the S&R levels.
If the market were made by S&R lines and not by people, then the exchange rate would always rise and fall to the same exact price points, over and over again. But because that rarely happens it's important to think of support and resistance as zones on the chart where people buy and sell.
One way to induce the habit to treat S&R lines as zones is drawing them with fat lines, avoiding a fine-point trace. That way you won't fool yourself into believing you have identified the exact price at which a currency pair is going to turn around and start moving in the opposite direction. And even better: draw the lines, especially the horizontal ones using two lines, an upper and a lower one, or use rectangles to mark the zones. Your chart platform has all these fancy tools for sure.
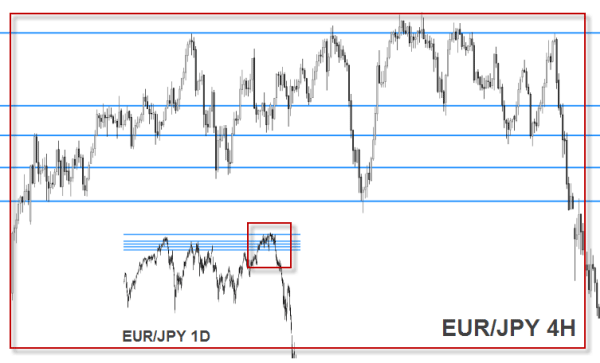
The chart above shows how differentiated S&R lines on a 4 hour chart form a price zone on a daily chart.
An exception to the zones are round numbers. All pairs, but especially the yen pairs, react to round numbers as S&R levels. Remember, round numbers are those that end by 00, 50 or 000. But even in those cases it is advisable to consider the area above and below that price as a S&R zone, because price action may well violate a round number and reverse. A round number is usually a cluster of thousands of market orders, whether it be limit orders to buy or sell, or stop loss orders. This clustering of orders around a same place is what gives a unique shape to the S&R level each time prices approach it and activates those others. Ultimately this is the reason why S&R zones are formed: when the price pierces a line and starts swinging around it. A S&R zone may, after some time, re-define itself as a line, but while it exists as a zone, the price may rebound at any point of it.
The concept of support and resistance zones follows the same logic as the horizontal lines, but while lines point to an exact price on the right side of the chart, the zones are represented by price ranges.
Like S&R lines, the higher the time frame the more extended and meaningful is the zone. Depending on the time frame, S&R zones can cover a range from 10 to 500 pips on the exchange rate scale.
Within an area of support or resistance, we are in no man's land and it is therefore difficult to take a position. In order to effectively trade within a S&R zone, you need to clearly differentiate the included sub-zones, and by going into lower timeframes, recognize the areas in-between the S&R levels. Those areas show the potential movement price can cover from one level to the other. This is only possible by submerging in deeper time frames, usually 3 or 4 stages below the time frame used to spot the zone.
The previous chart is a clear example: it would be very difficult to trade within the marked zone based on the daily chart – ideally, in this case, you should find trading opportunities to trade between the levels on a 60 minute chart or below.
Another important aspect is to differentiate what are the upper and lower borders of the zone. Those levels are usually those where the price had most trouble crossing and the reversal move is more evident.
Price Channels
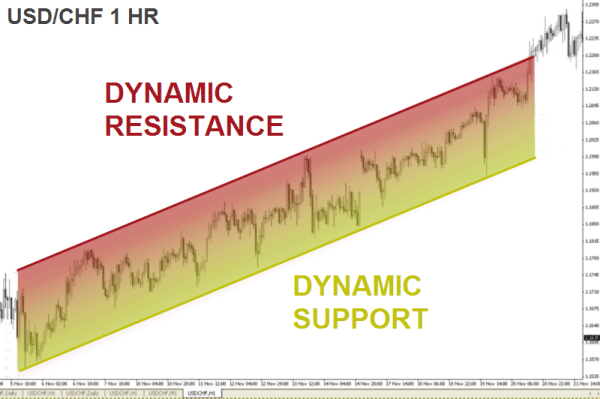
A channel is somewhat of a dynamic S&R zone: if S&R lines are not always horizontal, neither are the S&R zones. There are times when the trendlines connecting the swing highs and swing lows create a diagonal channel and price behaves similarly to an horizontal zone.
The support and resistance zones work the same way in a trend than in a range market. The only difference is that supply and demand forces adjust themselves to higher or lower price levels.
S&R changing roles
Resistances becoming support and vice versa is an action clearly seen during the evolution of a trend. This is due to key levels being broken and crossed by price. Once more, the USD/CAD on a weekly chart shows you the dynamic trendlines within a context of a down trend with successive breakouts:
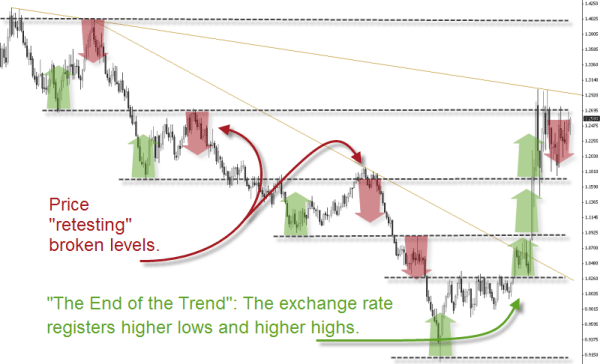
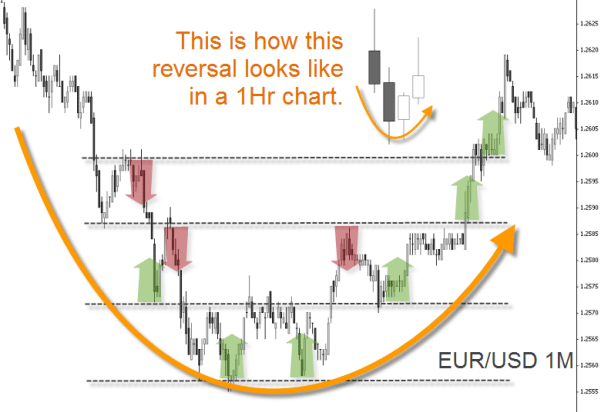
When the trend is bearish, as in the above chart, supports are broken and become resistance when price retests those broken levels. This price action will be called a trend as long as the swing lows and swing highs are successive. A so called “bias change”, or turn around, is evidenced when the sequence reverts and we see higher lows and higher highs again. The same happens in very small time frames too. The below chart is a one minute time frame on the EUR/USD:
In the video below you will see how candlesticks on higher timeframes hide those foot prints from lower timeframe candlesticks, and how important it is to switch between timeframes in order to understand price action.
Here's a brief video describing what happens inside the candles.
For a fine understanding of price action and an accurate trading method with breakouts please watch the different webinar recordings with Phill Newton
You can also download Phil Newton's presentation from the ITC 2008 about “Breakout Trading”.
By observing S&R levels we notice it's easier for rates to rise or fall across a territory with less barriers. That is why price can usually trends faster through areas where there has been no recent support and/or resistance.
This is what happens when the exchange rate enters a territory where it has never been before: the currency pair starts a "free rise", or a "free fall".
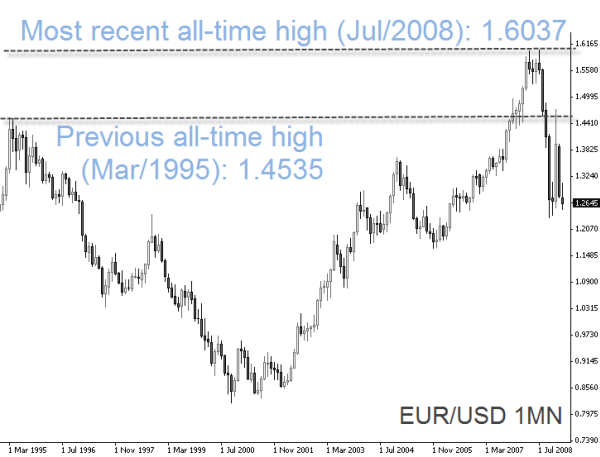
Back in 2007 it was impossible to determine, based on the EUR/USD price action, at which supply level the ascending move would eventually stop, since there was no historical resistance level above the all time high at that moment.
Breakouts are one of the most popular concepts in trading the financial markets. You can notice this fact when searching our trading strategies resources in the Education Section many of them are based on breakout ideas and each strategy can lead to a different trading approach while exploring the same core concept. In the next units we will cover trading strategies in more detail.
Would it be safe to say then that a breakout occurring at 5 pm Eastern time should fail at a major support or resistance level, and one appearing at a key time like 3 am Eastern time should plow through most support and resistance levels? In an edition of the Lessons From The Pros of the OTA, Ed Ponsi answers:
Thank you for your email, you're definitely on the right track. Not only do breakouts that occur at or around 5 pm Eastern time tend to fail, they usually fizzle out before they reach any significant support or resistance levels. Because of this, moves that occur at this time of day make excellent candidates for "fade" techniques, which is a type of trade that goes against a breakout because of the assumption that the move will not follow through. On the other hand, moves that occur after 3 am Eastern time have a better chance of success. In cases such as this, an opening range breakout strategy would be more appropriate. It's not unusual to see strong breakouts early in the London session, due to an increase in volume and the increased possibility of major economic news releases, so a fade strategy would be less likely to work at that time.
Identifying Pullbacks And Throwbacks
In the Forex market, trading breakouts can be tricky because very often momentum on a breakout will wane shortly after the break, resulting in an interesting phenomenon: a retracement of the exchange rate to the vicinity of the rupture. Only then, the price eventually resumes the direction started with the breakout. This retracement to a previous S&R level is known as "pullback" or "throwback" and is considered an opportunity to open positions with a minimal risk. In order to simplify the explnatation from here on, we will refer to both using the term pullback.
In terms of S&R, when we are in presence of an uptrend, a pullback is a descending movement of the exchange rate to the vicinity of the last broken resistance level. Conversely, in a downtrend a pullback is an ascending movement of the exchange rate to the vicinity of the last broken support level.
A pullback can consist of one candle (bar) or multiple candles (bars) depending on the time frame you are using. For strategic purposes it has to be clear where price is at the moment of a pullback and what is happening on higher timeframes.
During the early phases of a new trend, it seems like a certain inertia tends to slow down price action. A clear directional momentum which characterizes a trend is only evidenced when the trend already started. This is why new trends awaken usually from a choppy market situation and are very difficult to pick from the beginning.
If you are thinking of a solution to profit from trends, you better watch for pullbacks when price action is still under the influence of the old range: this new imbalance between bulls and bears often generates a series of tests or small congestion patterns while price tries to escape from the bigger congestion. Pullbacks are one of those small nuances in price action you definitely want to become a specialist at.
Once price action takes on a more vertical appearance and overcomes the inertia from an old S&R sequencing, meaning when either buyers or sellers assume control, it's usually too risky to enter a trade.
The accompanying diagram illustrates the phenomenon:
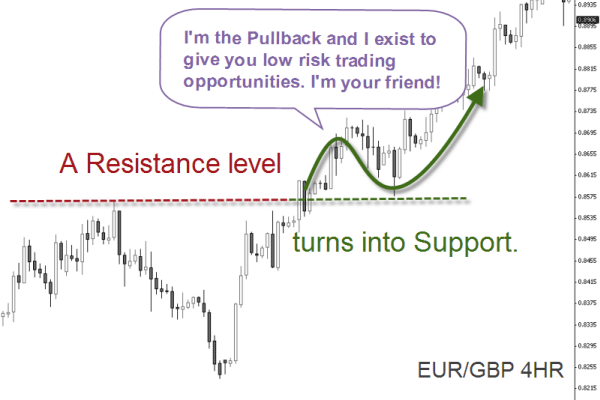
The pullback is usually a brief movement but that is still relative because it depends on the time frame. In the illustration above, price took over 70 hours to revisit the broken resistance level, converted in a support once broken. Notice how during the breakout the S&R level was blurred with price swinging back and forth. Indeed the pullback, afterwards, evidenced the support level very well. In other words, the pullback is the price action confirming a level has turned from support into resistance or vice versa, a resistance into support.
It is common among retail traders to enter and exit positions all at once. But this is not the way institutional traders usually place their orders - they do it gradually (the so called "iceberging"). On the one hand, they have to because of their large position sizes. Concerned that their orders might move the market, they avoid exerting too much buying or selling pressure at one time. On the other hand, they always search a better exchange price; this explains why the exchange rate doesn't mode in a straight line.
Trend following is therefore not synonym of chasing the market. Institutional traders know that waiting for the price to come back to their desired entry level represents a less risky and better rewarded chance than entering a position when price has already moved considerably.
The illustration below shows an unexperienced approach to pullbacks, with emotions leading to wrong decision taking, compared to a well planned low risk entry :
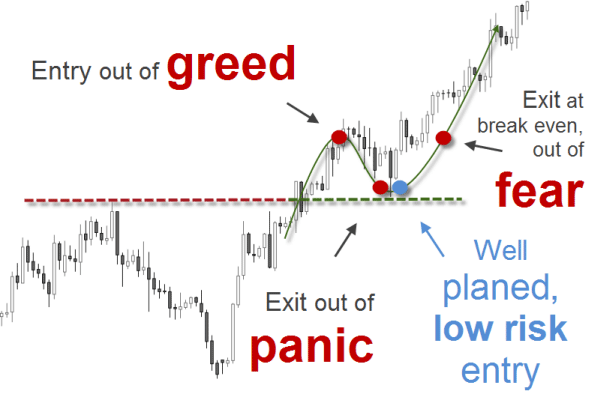
Emotions are surely one of the underlying forces during the processes of breakouts and pullbacks. Below follows a step by step explanation of the process:
The resistance: The above chart show a resistance level withstanding numerous rebounds, showing the exchange rate rising to the same price zone and bouncing back down several times. The reason why the price bounces back is because there is supply made of traders selling at that level on repeated occasions. They probably repeat their actions because the market has rewarded them with profits the first time they sold at that level.
The breakout: This happens until the resistance level is tested again but only few traders are still interested in selling. By this time, some of those who were acting as sellers before show instead more interest in buying and start entering long positions. As soon as the last seller enters the market, the first buyers will drive prices up, breaking the resistance level.
The pullback: Only this time the price breaks through and now more traders follow the herd and enter long after the breakout. As soon as the first few buyers cash profits for their short term positions, price loses its momentum and retraces to the former resistance, which is now support. This is when some of the participants who went long after the breakout begin to experience some serious anxiety and panic and close their positions. By closing long positions, they are selling to vigilant and experienced traders who buy knowing that a support level protects their stops placed just below.
Other buyers, ignorant of the pullback dynamic, are hoping and wishing for the exchange rate to rise to get out at or near the breakeven point. Afraid that they may have a big losing trade in their hands, they sell to the market as soon as their positions rise to the entry level. This bail out is driven by a different emotion: a feeling of relief. Guess whom they are selling to? To experienced traders adding up to their long positions.
As a retail trader, you can use the pullback and throwback phenomenon to your advantage by entering short positions at levels where the big traders are selling and entering long positions at the levels where the big traders are buying. By the same token, you can exit short positions at points where there is evidence of institutional demand, and exit long positions at points where there is evidence of institutional supply.
Pullbacks can also occur in conjunction with all types of S&R measuring instruments like Fibonacci levels, Pivot Points, chart figures, and technical indicators such as Moving Averages. A Fibonacci pullback, for instance, is literally a pullback that retraces to a Fibonacci level. There will be more in Unit B on how to use these tools as S&R indicators.
It's important here to notice that it's not as simple as placing a trade when you see a pullback develop. There are several procedures and a clear checklist should be elaborated to assess what the market is doing, where the pullback is developing, and so on. Further in the Learning Center we will cover solutions about how to effectively develop trading techniques to use once we've identified a price action pattern.
While blogging at FXStreet.com, Pierre Charlebois offered his particular view on charts with a combination of price action and trading psychology, The Disciplined Trader. For Elliot Waves interpretation it's a great resource as well.
Gaps
Gaps are a less frequent phenomena in the Forex market than pullbacks but still, they are part of price action. Why do prices gap? The answer is simple: they gap up because sometimes there is such a drastic imbalance between supply and demand that the exchange rate jumps many pips from one price to another.
It can happen during less liquid times such as bank holidays or over the weekend, between Friday's close and Monday's open. When there is more demand than supply at the Friday's closing price, the market will gap higher on Monday's open. Conversely, when supply exceeds demand at the Friday’s closing price, the market will gap down on Monday's open. In volatile market conditions, gaps happen more frequently but typically, it is at the open of the market when the biggest imbalances in supply and demand occur.
A successful trader is always searching for market situations where price is at levels where supply and demand are out of balance. He/she trades the exchange rate back to price levels where supply and demand is balanced again. As gaps are a well defined footprint of an out of balance condition, they can represent an opportunity as well to spot low risk, high reward, and high probability trades.
The advantage of understanding what is happening behind the scenes gears you with a certain objectivity and allows you to look beyond the candles and their patterns. You can then plan your trades in advance and avoid emotion related to mistakes.
Depending on the direction of the trend and the direction of the gap, the message can vary and so the way the opportunity can be traded. There are basically four combinations leading to a different interpretation and action each.
The four possible set-ups will help you determine the probabilities, the risk and the reward.
Gaps in a downtrend:
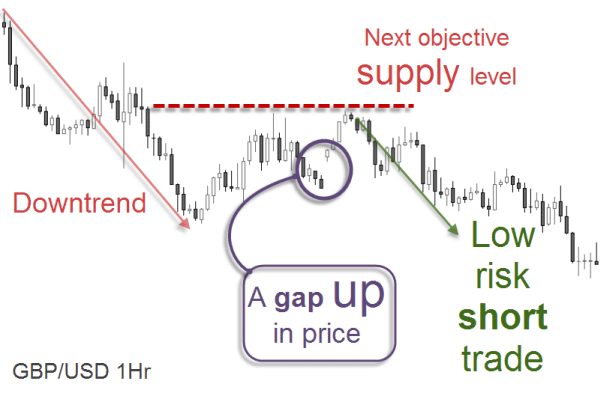
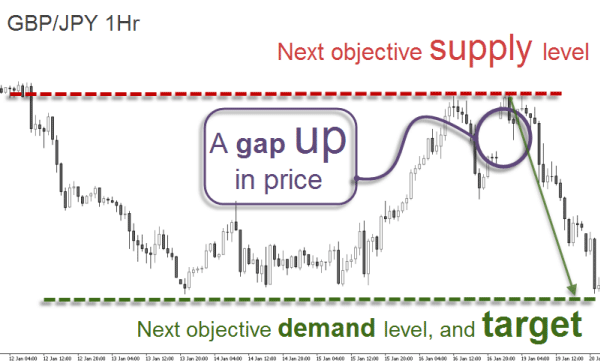
1) A gap up in price into an objective supply (resistance) level is a high probability shorting opportunity in the context of a downtrend.
The chart bellow shows a short position taking advantage of the gap up in price at the market open on 9th November 2008. In a downtrend, the idea herewith exposed is to sell short on a gap higher into a recent supply area - we want to sell to a buyer who is buying into a supply area in order to increase the odds in our favor. This type of gap is likely to get filled very quickly as we see in the five candles after the resistance has been touched.
And yet another example with profit target included:
2) Gap down into an objective demand (support) level. A gap down in price, in the context of a downtrend, can be a very high odds selling opportunity.
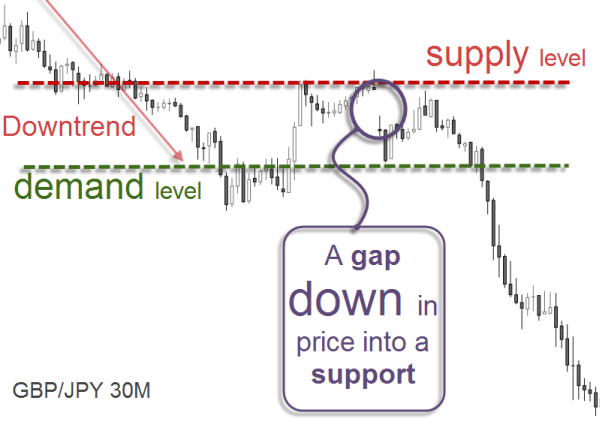
A gap down into a demand zone might be seen as a buying opportunity. However, when we consider that the main trend is bearish, the best set-up derives from identifying the next supply zone and enter short from there. This idea has a higher probability of success because the gap almost always get filled.
Gaps in an uptrend:
1) Gap up in price into an objective supply (resistance) level in the context of an uptrend can actually be a buying opportunity.
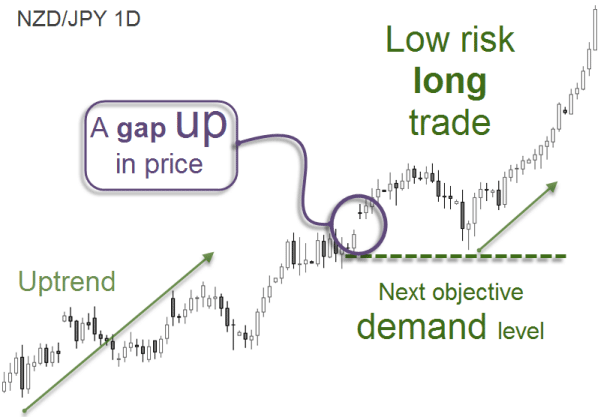
Notice how this gap up was the expression of buyers buying at a resistance (supply) level. This strong willingness to drive prices higher caused a breakout and a gap up in the exchange rate which was later filled by the pullback down to the same level, considered now a support.
2) A gap down into an objective demand (support) level during an uptrend indicates a buying opportunity.
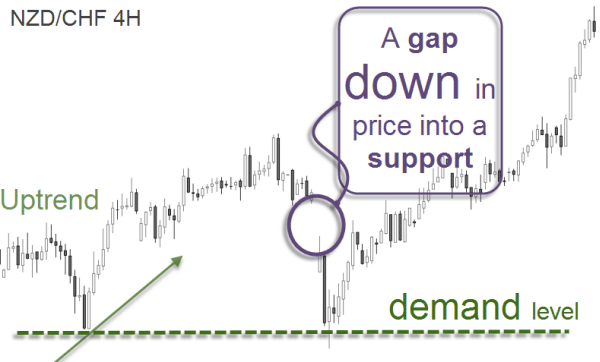
Buying on a gap down into demand is a great opportunity, specially in an uptrend. Think whom you are buying from at the demand (resistance) level: from inexperienced traders who sell after a gap down in price into a level where buy orders are sitting.
The Online trading Academy enters into much details about how to classify gaps and trade with them in his articles and webinars:
This is a brief excerpt from one of the articles, written by Sam Seiden:
While there is much more on gaps than one can write about in a short piece such as this one, keep in mind that the picture of the ultimate supply and demand imbalance is a gap. When you are ready to take a trade, simply ask yourself "who is on the other side of my trade?" and make sure you are trading with someone who is making a big mistake according to the laws of supply and demand, motion into mass, or whatever version of this basic governing dynamic you want to call it.
Instead of looking at red and green candles on a chart and following a conventional Technical Analysis book, start looking a little deeper and begin to understand the order flow that is responsible for the creation of those candles. These basic thoughts will likely give you an edge over those who are on the other side of your trades and having that edge is the key to trading anything. If you are tired of transferring your account into someone else's, stop looking at the market the same way everyone else does.
Chart patterns as the ones disclosed here have true predictive power and emit an evidence that you can detect and measure. Each independent pattern is different but, approached with a certain methodology, it can raise the odds that a trade set-up will produce a valid result. In the following section we are going to converge diverse elements so you can start developing an efficient trading methodology.
The contents herewith provided will enable any trader to minimize questionable entries and improve exits. By objectively identifying support and demand levels on a chart, trading positions can be taken with a much favorable risk to reward ratio.