4. Measuring The Movement Ahead
The following lesson is another building block on how to quantify demand and supply levels on a chart and find conditions of a big imbalance between those forces. Before you can move into rule-based strategy lessons in the next units it's important that you understand that to be a consistently profitable trader you don't have to collect tons of information about the market and search for that magic indicator to analyze it. It should suffice to focus on a few clear and objective price action patterns and start to think about applying rules to capitalize on them.
The Most Common Mistakes
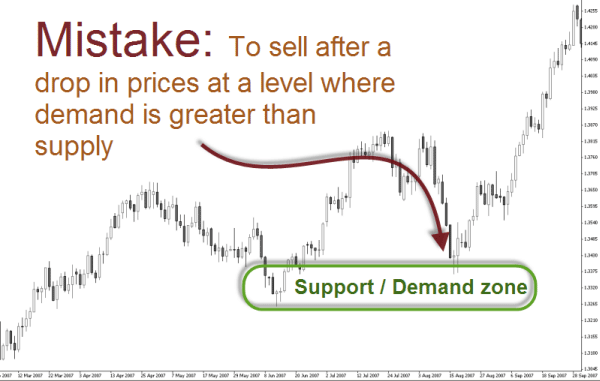
The novice trader usually follows the price movement and ends up buying at resistance and selling at support. Selling into an objective supply level or buying into an objective demand levels ensures a consistently losing outcome. It's like trying to cross a wall by running against it.
The image below illustrates this unhappy outcome for someone who probably trades without the knowledge of price dynamics.
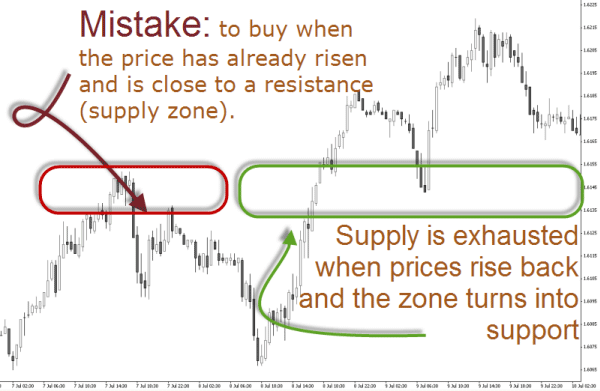
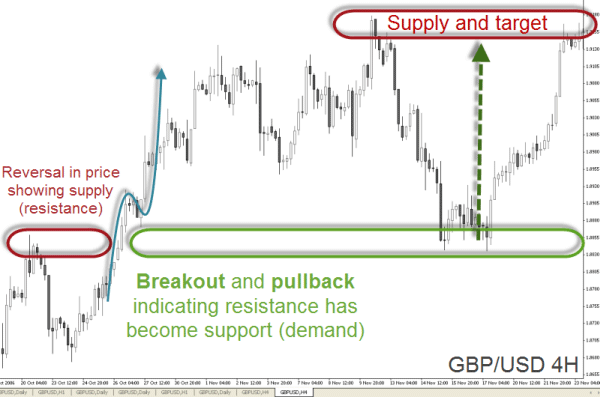
The above chart shows the EUR/CHF in 30M around July 2008. Clear trading opportunities can be seen here: just do the opposite the novice trader is doing. The first pullback on the right side of the chart shows a clear opportunity to enter short the market and target the support zone on the bottom of the chart.
The second pullback after the crossing of the supply zone, now converted into demand, is another low risk entry for a long trade.
This is a list of webinars where price action is the main focus. Take the time to review them as the material is of excelent quality:
- Drilling down, Support and Resistance series, by Triffany Hammond
- How Support and Resistance is one of the Important keys to Safer Trading, by James Weegen
- An introduction to Price Behaviour: Part 1, by Mike Baghdady
- An introduction to Price Behaviour: Part 2, by Mike Baghdady
- An introduction to Price Behaviour: Part 3, by Mike Baghdady
- An introduction to Price Behaviour: Part 4, by Mike Baghdady
- Low Risk Breakout Trading in Forex, Sam Seiden
Define Your Edge
The concept of support/resistance is undoubtedly among the most important and most followed aspects of chart analysis and trading in general. Whether you are shaping a technical or fundamental profile, or mixing both approaches, chances are that you follow support/resistance principles at least to some degree in your trading.
There are many different methods of denoting support and resistance levels besides the horizontal levels, diagonal trendlines and trend channels, like pivot points, Fibonacci levels, moving averages, among others. Which one is best is a question of personal preference. But the fact is that the same principles apply to all of them. This common principles, if well understood, will give you an excellent ground on which to build your trading knowledge and will represent an ever accompanying edge for your trading. To attain an edge in a trading career constitutes the difference between success and failure.
To own an edge is to know objectively that there are likely more chances to win than to lose. But watch out, because having the odds in your favor is not the same as knowing or believing that you will win. Let the market do what it wants, knowing that it can do anything. And when the market does what you expected then you have an edge because you know you have a statistical advantage in your favor.
An edge can therefore be based on a favorable price pattern that you've seen multiple times and from which you can quantify the outcome. This means that you can try out a particular set-up repeated times and witness a certain outcome in the majority of the occurrences. This testing of ideas is of utmost importance for the development of your trading because it provides objectivity based on historical evidence.
If at this stage of your training you don't have any edge, then consider it to be your next target while developing your personal trading system. Perhaps you don't see the importance of having an edge for the moment, but without this element it will be impossible to win consistently.
In this chapter, the concepts you can take as an edge are based on the principles of S&R, being the most basic aspect of price action and technical analysis in general. Although an edge can be based on any idea or concept, adopting S&R principles, is providing your analysis with a logic applicable to any instrument and at any market condition.
These principles are the backbone of a contrarian attitude in trading. In the chart below you can see what is meant by contrarian: while the crowd sees a selling opportunity when price drops heavily, the astute contrarian trader sees buying power increasing due to the proximity of new group of buyers at a demand level (green zone). This type of counterintuitive logic, generated by recognition of the underlying forces in market dynamics, can make a big difference in your trading.
Locate these great opportunities in the convergence of specific imbalances in supply and demand by using recurring price action patterns such as the pullbacks and throwbacks. By interpreting these price footprints correctly, you will find low risk trading opportunities with a measurable outcome and book consistent profits as a trader.
On Raghee Horner's blog (in the "Price Action" category), you will find a good examples on how price action can be used as an edge to trading.
Hi Ed, I was wondering if you would do the honor of providing a brief description - maybe 2 or 3 paragraphs - describing your primary approach to foreign exchange trading from a strategy perspective.
Ed Ponsi answers:
Thank you for your question. Regarding technique, I'm primarily a trend trader. I look for situations where the technicals mesh with the fundamentals - if there is a clear trend in place, and if the fundamentals confirm what I see on the chart, I'm going to try to grab a chunk of that trend. One thing I'm very cautious about is trading the breakout - if the trend is moving upwards, I want to go long but I don't want to buy into a currency as it's hitting new highs. Because there are so many false breakouts in Forex trading, my strategy is to try to catch the pullbacks. That way, even if the currency pair fails to break through, there is still some potential for profit when the pair reaches resistance.
One of my favorite situations is a false breakout that moves against the trend. These types of breakouts have a high failure rate, and they also set the stage for a "slingshot" trade in the opposite direction. It's a great setup, and I'm constantly looking for it. If the trend is strong enough, I might not use a target at all; instead, I'll trail a stop. I like to trail stops manually, moving them strategically instead of automatically. That way, I can keep my stop beneath a trendline or a moving average, instead of moving it to an arbitrary location - which is often exactly what happens when we use automatic trailing stops."
Measuring S&R Levels
Many aspiring traders have great difficulty organizing price action into a manageable execution system. Too often they ignore important chart data because it doesn't fit into a convenient technical system. This obsession with simple-minded pattern recognition or pure technical signal trading prevents the trader from grasping the most powerful mechanics of price prediction.
Concentrating on a narrow execution strategy is like using a broken watch- it will be right two times per day but still useless the rest of the day. This explains the frustrating path many novice traders experience in their search for the holy grail. Despite their vast knowledge on complicated technical analysis, they are unable to grasp the underlying mechanics.
Expand your trading knowledge through the observation and application of the herewith mentioned principles. By integrating S&R analysis in your charting you will expand your ability to profit from subtle aspects of crowd behavior. Keep in mind that market forces of supply and demand rely upon mechanics that many traders will overlook. This lets you gain an important edge on the path to successful trading. It might take a lifetime to explore the most fine nuances and complex interactions between evolving price and the emotional crowd. But rest assured, the principles you are learning in this chapter will gear you with a finer look into price action.
Here you have some quick tips to assess the significance or validity of support and resistance levels, whether it be in the form of drawn lines or zones:
1. Number of contact points
A level that has been touched or tested more times is considered to be more significant than one that has been tested less times. The more times the exchange rate has been halted by a support or resistance level, the bigger is the expectation on the eventual breakout movement. In terms of order flow, the more times price reacts to a support level, the less buy orders will be kept active at that price level. The same is valid for a resistance: the best time to profit from selling at a resistance level, is the first time the price comes back to it after manifesting a strong imbalance at that price level.
2. Length of time
It’s common interpretation that the higher the time frame (days, weeks, months), the more powerful the level becomes.
It is said that trendlines that develop on a monthly, weekly or daily chart are more significant than those that develop on intraday charts because higher time frames are used by higher capitalized market participants.
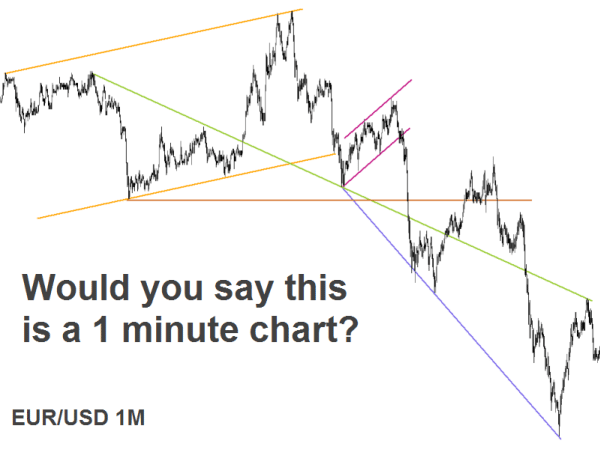
This doesn't mean smaller time frames don't have support or resistance levels which can be used to trade. The below EUR/USD chart could be easily tagged as a 60 minute chart, but in fact it is a 1 minute chart! Recall that this pair is the most liquid one in the Forex market, which makes smaller time frames technically very accurate.
3. Shape of the rebounds at the contact points
You should not be guided solely by the number of times the level acts as S&R, but also by the quality of the reaction. A level of support or resistance indicates strength depending on the magnitude of the bounce. Clearly visible reversals in price action (in "V" form) establishing new highs or lows on a chart are valid as support or resistance levels and can thus be used as contact points to draw trend- or horizontal lines.
4. Angle of the trendline
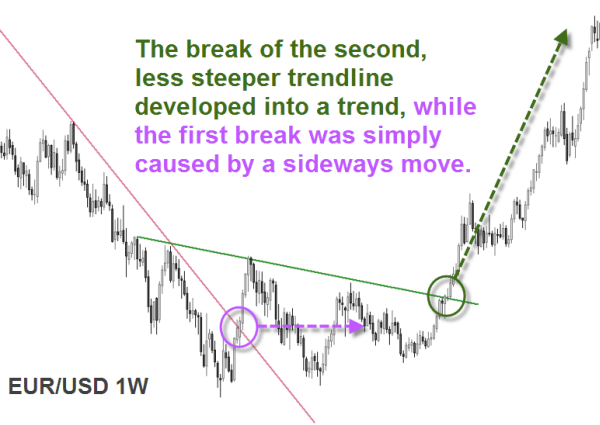
The sharper inclined the line is, the easier it will be for price to cross it- it only has to move sideways to break the line.
As a rule, every trendline will be broken at some point in the future, and as such, trendlines with steeper angles are more likely to be crossed than the ones with angles inferior to 45 degrees. This happens because trends with gradual price increases or decreases are more likely to last than those rapid price movements which usually call for a correction. The penetration of a steep trendline does not necessarily indicate the reversal of a trend, it can just be a retracement to a more gradual price movement.
Note, the angles of inclination and declination are relative to the type of chart you use and the amount of data included - zooming in and out will change the angles of the trendlines. Moreover, the same trendline can appear differently on arithmetic charts than on logarithmic charts. But in any case, the most fruitful analysis adopt these common principles, so that a visual comparison of S&R intensity is surelly an edge for any trading method.
With the knowledge provided in this section and through the accompanying readings and videos as well as the material contained in the Practice Chapter A, you will train your eyes and finally learn how to objectively measure price action.
What you have learned from this chapter:
- Support and resistance represent key junctures where the forces of supply and demand meet. In the financial markets, prices are driven by excessive supply (down) and demand (up).
- Price action tells us that only the facts matter and price is the utmost “fact”. It also tells us that the facts happen for the purpose of achieving equilibrium between supply and demand. Finally, the outcome of this endless quest for equilibrium can be seen as chaos.
- Price action, that is the "attitude" of the price at key support and resistance levels can betray the next directional move. That is why a set of simple rules is needed.
- Gaps in price are useful because they are the picture of the ultimate supply and demand imbalance.
- Identification of key S&R levels is an essential ingredient of a successful price chart analysis. Even though it is sometimes difficult to establish exact support and resistance levels, being aware of their magnitude, location and shape can greatly enhance analysis and forecasting abilities.
- Price action is an extremely valuable resource in bringing many technical traders, who are often enamored of the latest indicator or technique, back to the basics.
- Price acction limits data intake such as news or signals from technical indicators to specific price action patterns thus filtering out those noise levels that can defeat profits.
FXstreet.com contents:
- Gaps, The Novice Trader Exposed… by Online Trading Academy
- Trends, Gaps, and Probabilities... by Online Trading Academy
- Three Simple Principles by Online Trading Academy
- Using Non−Time Based Charts for Short−Term Forex Trading by Dr. John Clayburg in The Forex Journal
- Pivot Point Analysis by Online Trading Academy
- Support and Resistance, a Deeper Understanding by Online Trading Academy
- Reports by Phil Newton
- Longer-term Support and Resistance Trading: Setups and Rules – Webinar Recording
External Links: