2. Economical Indicators Related
An economic indicator is a statistical or informative data collected and published on a regular basis by a government or private entity. The indicator records the activity in a particular economic sector or in an entire economy.
Economic indicators are important to Forex traders, because they represent vital data to understand the macro picture of a currency’s economy. They also help to anticipate future market activity and to determine whether a particular currency is over- or under valued. Macroeconomic indicators include figures such as growth rates, interest rates, inflation, employment, money supply and productivity.
Since any foreign currency transaction involves the exchange of one currency for another, fundamental analysis is also related to the supply and demand of each currency. Remember that in a free floating market it's supply and demand what ultimately determines the exchange rate. Hence, fundamental analysts try to ascertain the supply and demand balance by studying various economic indicators.
From the fundamental models covered in the previous section, we can understand that some economic indicators will affect the supply and demand of the domestic currency, while other indicators will be affected by it. As with technical indicators, fundamentals can also be classified as leading or lagging. The difference lies in whether an indicator tracks economic factors that will affect the future of the general economy or records an economical activity that has already taken place. Central banks, for instance, rely on economic indicators to formulate their monetary policy which, in turn, can have a significant effect on foreign exchange rates.
Some indicators work thus as leading indicators for other economical data. In this section, we will see how economic indicators are interrelated. The information herewith disclosed will help you design a plan of action, perfectly suitable to be combined with a technical approach.
A subsequent approach
Many analysts and traders agree that fundamental analysis can be very effective to see the big picture. But trading fundamentally in the long-term might not produce enough actual trades during your window of opportunity to make it worthwhile. Besides, many analysts also sustain that fundamental analysis has its limitations when used in the short-term, arguing that it can be very subjective. The following section is meant to deal with these limitations, and show you there is a way to trade fundamentally.
There is no doubt exchange rate movements in the short-term can be news-driven. Announcements about interest rate changes or changes in the growth path of economies are some of the factors that impact exchange rates also in the short run. Nonetheless, when a report is to be released, the trader can have the analysis absolutely nailed but he could see no market reaction or even the exchange rate going in the opposite direction of what was expected.
This is because every economical data is somehow related to other data. The announcements have to be seen in their actual context, and there is a lot of information to keep track of. Moreover, it is more about the traders' perception of the announcement than the published figure itself.
Therefore, by means of the trading approach you are about to learn, you shall have the chance to focus on specific reports and how they relate to other reports in the context of certain economies.
Sure it takes time to do it properly, especially when you are just starting, but it can be a very powerful tool. If you have the time and inclination, it's something worth exploring.
Economical reports are considered to have notable effects on the financial markets with some clear ramifications for the Forex market. The below map shows the indicators we are going to study and how they are related to each other.
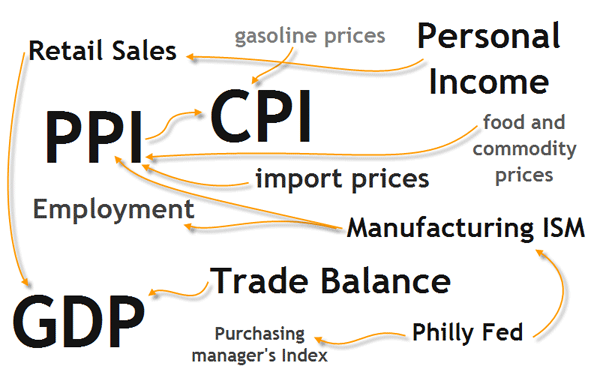
Because of the USD status as reserve currency it is arguably the currency of reference. That is the reason why economic indicators in many major countries don't have the same impact on the exchange rates as the US data. For this reason the listed indicators are some of the more important US indicators.
Later, in the Practice part of this Unit we will do the same study with other major economies.
Obviously, there are many more indicators for the US economy than the ones listed here. But instead of listing the huge amount of figures that exist, we will pick only the ones that are being followed by the vast majority of traders worldwide, and relate them to each other. We will study here:
- Consumer Price Index (CPI)
- Producer Price Index (PPI)
- Gross Domestic Product (GDP)
- Retail Sales
- Personal Income
- Trade Balance
- Institute for Supply Management Manufacturing Index (ISM)
- Philadelphia Fed Index
- Goods and Services Imports
Take into account that economical indicators fade in importance depending on the economical circumstances. They come in and out of vogue and there are times traders pay much attention to a particular announcement and then it is replaced by another indicator which becomes more popular. The trader has to be flexible enough to watch an indicator with a completely different set of criteria from time to time.
Consumer Price Index (CPI)
Definition: The CPI is a consumer-level index designed to measure pure price change of a fixed market basket of goods and services, representative of the purchases of a typical urban consumer. CPI is classified among the economy-wide indicators which are the broadest measures of productive activity and record the result for an entire economy.
The Core CPI is calculated in the same manner as the CPI but it excludes items with high volatility such as energy and food which are vulnerable to price shocks, leading to a distortion in the CPI calculation.
Why does it matter? It is considered to be one of the most effective indicators revealing the current state of inflation in an economy. The inflation rate, which is the rate at which prices of goods and services change, is determined by the economy's need for money and by the supply of money. In order to determine whether the money supply is great enough to meet the needs of the economy, we need to know the inflation rate. Inflation data is also needed to monitor the effectiveness of a monetary policy in its effort to promote maximal economic growth.
Economic growth has to be understood in a cycle made of inflation and interest rates. Growth typically creates higher wages and full employment, which increases the aggregate demand. When inflation begins to escalate too fast, it deteriorates asset values and it affects savings - people are unable to save money because of higher prices. In order to control inflation in periods of economical expansion, the Federal Reserve (that is the US monetary authority) will adjust interest rates to cool off the economy. Higher interest rates curb expansion as it makes growth more expensive reflecting the fact that the cost of money is higher.
When inflation is low and growth is also falling, the Federal Reserve can lower interest rates in order to stimulate growth.
The inflation rate is determined by the general price increases of consumer goods and services over time. The best way to measure it is using an index which reduces the prices that consumers spend in one year to a simple number that can be easily compared to other years. Based on a starting index value of 100, if the CPI for the current period is, let's say, 114, the indication is that it now costs 14% more to buy the basket of goods today than it was when the index was first established (in 1982-84). By comparing the monthly CPI data, you can easily detect changes in consumer's buying power from month to month.
Acceleration or deceleration of inflation, as signaled by the rate of change of the CPI, can indicate that a change in monetary policy may be appropriate.
A CPI that continues to trend upwards month over month could be a signal that inflation is eroding buying power to the point that the central bank will raise interest rates to curb spending. As a result, an increase in interest rates may lead to an increase in demand for the currency as its higher interest rates make the currency more attractive for global investors, as we have seen in the above real interest rate differential model.
This is the normal cycle, but is it always like this? Unfortunately not. There are several limitations when dealing with CPI. One is the basket of goods being highly subjective and different from country to country. Another one is the fact that core CPI number exclude goods that consumers have to purchase anyway such as energy and food. This means that inflation may not be really a result of economical growth.
The cycle we described above breaks down when the economy experiences dramatic price increases or decreases. Oil, for instance, is many times related to those price shocks as seen in the past. For this reason, oil prices act as a leading indicator for CPI.
In any case, in times when there are concerns about inflation, the CPI gains in importance despite its limitations. As with other indicators - even technical ones - don't worry too much about its handicaps and try to extract the valuable information it contains. Understanding CPI can be translated in trade opportunities and guidance in managing their overall risk. It is not because of its inherent value but because of the attention that traders pay to it that CPI is relevant. Specially important for traders and analysts are the developing trends in CPI results and the breaking points between inflationary and deflationary periods.
Released by: US Department of Labor; Bureau of Labor Statistics. Look for “Consumer Price Index Summary”, as it is the most popular measure of inflation.
Frequency: CPI results are published on a monthly basis. Generally available the second week of the month immediately following the month for which data is being released. It's always released after the Producer Price Index.
Note also that in the USA most indicators are published on certain weekdays, rather than on a monthly date.
Producer Price Index (PPI)
Definition: The PPI is not as widely used as the CPI, but it is still considered to be a good indicator of inflation. Generally, the PPI is also collected by governments and it's considered to be among the most authoritative statistics.
This indicator measures and reflects the change of manufacturers’ cost of raw materials and semi-finished goods retrieving data from production and manufacturing firms across several sectors (manufacturing, agriculture, mining and utilities ). The PPI is also a basket of various indexes covering a wide range of areas affecting domestic producers. Like the Consumer Price Index, the PPI compares the current price index to a base value of 100 – this means that a PPI value of 115 is 15% higher than the original base.
In order to avoid distortions on the PPI figures, the Core PPI excludes volatile items such as energy and food. A sudden spike or fall in oil prices or other unexpected event is not reflected in the data released.
Why does it matter? The PPI, while not as strong as the CPI in detecting inflation - because PPI includes goods being produced -, can be used as a leading indicator to forecast future CPI releases.
The PPI index printing higher figures suggests an expanding economy with reasonable assurances of continued employment for those working in the manufacturing sector. An increasing PPI value could also indicate an interest rate hike intended to fight inflation.
For Forex traders and followers of the real interest differential model, a rise in interest rates means an increase in the demand for the currency as investors can expect increased returns. But concerns over increasing inflation, specially in the US, may outweigh benefits of a high interest rate (see the monetary model of exchange rate determination in the previous section). So overall, the effect of PPI on the USD is moderate in comparison to other markets.
You should also note that the PPI report is the first of the inflation-based reports available each month. It will usually receive close scrutiny as traders look for signs of inflation or deflation that could impact on the CPI released shortly after.
For the long-term trader the PPI and CPI numbers are used to track price pressures that can help to anticipate inflationary consequences in the near future.
The short-term trader, in turn, will not be so much interested in forecasting interest rate changes, but rather use the PPI as leading indicator to estimate the CPI result since this indicator has ultimately more impact on the market. If you follow this approach, don't forget to spot for oil prices as they also will impact on the CPI index.
Released by: US Department of Labor; Bureau of Labor Statistics.
Frequency: It is released in the second full week of every month, covering the previous month's data.
Gross Domestic Product (GDP)
Definition: In the US, the Federal Reserve's primary goal is to keep a sustained growth of the economy with full employment and stable prices. The information provided by the GDP index is a gross measure of the big economical picture. Representing the monetary value of all the goods and to signalservices produced by an economy over a specified period, the real GDP is the most comprehensive measure of the country's production and it is indicative of inflation pressures.
To determine the GDP results, purchases of domestically-produced goods and services by individuals, businesses, foreigners and government entities and the trade balance are routinely captured. In short, everything that is produced within the country’s borders is counted as part of the GDP. For this reason it's perhaps the broadest indicator of the well-being of an economy.
The published output is available in nominal or in real terms (also called index form), meaning increases in the the results due to inflation have been removed. Analysts and traders usually monitor the real growth rates generated by the GDP quantity index or the real dollar value.
The nominal, current dollar, GDP corresponds to the market value of goods and services produced and it's calculated using today's Dollars. This makes comparisons between time periods difficult because of the effects of inflation. The real GDP, the index form, in turn, solves this problem by converting the current information into some standard era Dollar.
The GDP is typically lower than the consumer price index because investment goods (which are in the GDP price index but not the CPI) tend to have lower rates of inflation than consumer goods and services.
Why does it matter? GDP indicates the pace at which a country's economy is growing (or shrinking). By monitoring trends in the overall growth rate as well as the rate of inflation and the unemployment rate, policy makers are able to assess whether the current stance of monetary policy is consistent with the goal of sustained growth.
Fundamental analysts and traders track important trends within the big picture using the GDP. Stronger GDP results in the current year compared to the previous year is seen as a positive indicator. Logically, if the value of a country’s production has raised, then a corresponding increase in employment and higher incomes will follow. This scenario, in turn, suggests that the domestic currency may increase in value compared to foreign currencies from countries with weaker economies. A higher value for a currency paves the way to an increase in its demand, right?
Conversely, an increase in inventories indicates that growth is slowing or consumer demand is weaker, and usually translates into a decrease in demand for the domestic currency.
The GDP can also be seen in a wider context. In many economies, borrowed money makes up a large percentage of spending. This means that GDP results will depend on how easy and cheap the general population can borrow money. Under this perspective, when interest rates are expected to go higher, people will be expected to save and therefore spend less money, and economic growth will be expected to slow as a result. Conversely, when low interest rates make cheaper for people and businesses to borrow and spend money, economic growth will be expected to rise.
The trade balance, being one of the major components of the GDP, can be used as a leading indicator for GDP forecast. Traders also monitor retail sales because it provides them an hint on personal consumption expenditures, another component of the GDP. When retail sales are growing faster than production inventories, production in the months ahead is likely to increase. Conversely, when retail sales are growing more slowly than inventories, they represent a slowdown in production and a possibly lower GDP figure. Here you have two leading indicators for GDP estimation.
The major components of the GDP can be monitored separately as they all reveal important information about the economy.
For instance, it is useful to distinguish between private demand versus growth in government expenditures. Typically, analysts and traders discount growth in the government sector because it depends on fiscal policy rather than on economic conditions.
Increased expenditures on investment are viewed favorably because they expand the productive capacity of the country. This means that the country can produce more without inciting inflationary pressures.
Particularly in the US, with imports typically exceeding exports, traders observe if the deficit becomes less negative, meaning a smaller amount is subtracted from the GDP, translating into more economic growth. In turn, when the deficit widens, it subtracts even more from the GDP.
Released by: US Department of Commerce; Bureau of Economic Analysis (BEA). Look for “News Release: Gross Domestic Product”.
Frequency: It is usually measured annually, but quarterly statistics are also released in the last week of January, April, July and October. The US Commerce department revises the GDP twice before the final figure is settled upon: an advance report is followed by a preliminary report and later a final report is published, covering the previous quarter's data.
Quarterly results are subject to some volatility, so it is appropriate to follow year-over-year percent changes in order to smooth out this variation.
The first or “advance estimate” is released during the final week of the month immediately following the end of a calendar quarter. Within a month it is followed by the "preliminary report" and then the "final report" is released another month later. Significant revisions to the advance number can move the markets.
Annually, benchmark data and new seasonal adjustment factors are introduced in the second half of the year, usually in July. This revision affects at least three years of data. The magnitude of the revision is generally moderate and makes the short-term use of the report rather difficult. Nonetheless, it has an impact on the immediate currency value.
Retail Sales
Definition: Retail Sales belongs to the industry and sector-based statistics. This type of indicator is collected by both government agencies and private sector groups. The activity they track is more limited, and can have a close correlation to the broader indexes, generating considerable trading interest.
This indicator measures the total sales of goods by all retail establishments in the US, excluding sales of services such as health care and education. Sales are categorized by type of establishment, not by type of good.
The Census Bureau surveys hundreds of various sized firms and business offering some type of retail trade. Every month the data is released providing feedback on the percent change from the previous month data. A negative number indicates that sales decreased from the previous months' sales.
The report is published without adjusting for inflation, that is, in nominal Dollars. So to get a true measure of changes in retails sales spending, you must adjust accordingly. However, the results are adjusted for seasonal, holiday, and trading-day differences between the months of the year.
Why does it matter? This indicator can be a big market mover because retail revenues are a key driving force in the US economy. It tracks the merchandise sold by companies within the retail trade providing feedback on consumers' activity and confidence. Higher sales figures correspond to an increased economic activity and vice versa.
The Personal consumption expenditures (PCE) represent roughly 2/3 of the GDP. By monitoring retail sales, policy makers are able to make an assessment of the likely growth of the PCE for the current and future quarters. The retails sales report can be seen as not particularly related to the currency market, however, it might indicate an overall growth or slowdown of the economy, making the currency more or less attractive to investors. The key point is that retail sales can be used as a leading indicator to forecast GDP figures.
Remember, trade balance and retail sales pointing in the same direction can give you an edge to position yourself in the market in anticipation of the GDP release.
Compiling accurate and complete retail sales totals can be very difficult and the "quality" of the published data may differ over time. For this reason, it is not uncommon for the retail sales report to undergo significant revisions after the release. There have been instances where the published figures significantly differed from expectations.
Generally speaking, if economical indicators can induce a burst of activity when the results come out as expected, any economic indicator that releases unexpected results causes a much greater reaction in the markets.
As a general rule, watch not only for the numerical value of an indicator, but also for its forecast value. If your leading indicators are pointing in a different direction than the anticipated results, expect a greater impact on the market.
The value of the indicator is considered important if it presents new information. For example, if the trade balance and retail sales point to a slowdown in the economical growth, but the expected GDP does not, you should expect a surprise reaction in the market because the final GDP release will be instrumental to drawing new conclusions which couldn't be drawn with the previous release.
The fastest moves usually occur when an unexpected information is released. This is key to the short-term fundamental traders, also called news-traders, because what drives the currency market in many cases is the anticipation of an economic condition rather than the condition itself.
To put you ahead of this situation, you can watch the personal income data, which is a leading indicator to retail sales.
Released by: US Department of Commerce, Census Bureau.
Frequency: The data is very timely because the retail sales advance estimate is released during the second week of the month for the immediately preceding month. It's also one of the first reports available each month that tracks retail spending patterns.
Here are other industry and sector-based statistics which are somehow related to the above mentioned:
Personal Income
Definition: Personal income points to the change in the dollar value of the income collected from all sources by consumers and serves to measure future consumer demand. The largest component of personal income is wages and salaries. Other categories include rental income, government subsidy payments, interest income and dividend income. A component of this figure, comprised of durable goods, non-durable goods and services, covers personal consumption expenditures or PCE. PCE is even more directly tied to the economy.
Why does it matter? Income is correlated with spending – it gives households the power to spend and/or save. The more disposable income consumers have, the more likely they are to increase spending and saving. Spendings accelerate the economy and keep it growing. Savings are often invested in the financial markets and can drive up the prices of financial assets. Even those funds saved in banks can be used for credits and thus contribute to the overall economic activity.
Needless to say, if the actual figure is bigger than its forecast, you should expect a rise in the USD. But more important under our subsequent approach is to use personal income as a leading indicator for the retail sales.
Released by: US Department of Commerce; Bureau of Economic Analysis (BEA). Look for “News Release: Personal Income and Outlays”.
Frequency: The Commerce Department releases the personal income and consumption figures the fourth week of each month, the day after GDP figures are published, using data from the previous month. The released data is for the previous month.
Trade Balance
Definition: Trade balance, the largest component of a country's balance of payments, is the difference in the value of its imports and exports for the reporting period.
Export data can give an important reflection of US growth. Imports provide an indication of domestic demand, but this figure is published later than other consumption indicators. A country has a trade deficit if it imports more than it exports, and the opposite scenario, signaled by a positive trade balance, is a trade surplus.
Why does it matter? Despite not being the only indicator offering insight into a country’s trade activities, the trade balance is considered to be the most useful. If an economy is exporting more than it is importing, the global demand for that economy's currency will likely increase, which will also increase that currency's value. If the balance of trade shows a surplus or even a declining deficit from the previous month, then there may be an increased demand for the national currency. It naturally happens because countries importing goods must convert their currency to the domestic currency of the exporting country.
The opposite scenario, when the report shows a growing deficit or a trend towards a decreasing trade surplus, then the increased supply of the currency could lead to a devaluation against other currencies.
The Trade Balance report influences GDP forecasts. This happens because net exports are a relatively volatile component of the GDP. Trade balance gives an early indication of the net export performance for each quarter and can thus be used together with retail sales, as a leading indicator for the GDP.
Released by: The Census Bureau and the Bureau of Economic Analysis of the Department of Commerce.
Frequency: This indicator is usually released on the second week of each month, covering the previous month's data.
Institute for Supply Management Manufacturing Index (ISM)
Definition: The ISM report is based on data compiled from a national monthly survey made among purchasing executives at several hundred industrial companies. In response to these questions the executives can give only one of three answers which are: “better”, “the same” or “worse”. It provides an accurate assessment of manufacturing totals and is a highly relevant assessment of industrial growth.
It reflects a composite of several indexes covering areas such as industrial production orders, industrial prices, new costumer's orders, employment, supplier deliveries, to name just the most important. This report uses a base scale of 50 to show changes in growth for the manufacturing industry. A reading above 50 indicates an expansion over the previous month in the component index or in overall manufacturing. If main number and data are under 50 points it shows a contraction. Results are adjusted to take into account seasonal changes in the industry. The ISM also sets the standards by which regional industrial indexes are measured.
Unlike many of the other releases covered in this section, the ISM manufacturing number is quite easy to read. Nonetheless, it is important to follow the release for several months to get a feel of what the market reactions are, before incorporating this indicator into your trading.
Remember, the market reacts not so much to the reports being good or bad but rather if they are better or worse then expected. Moreover, each indicator has its times of glory: contextual circumstances give to one indicator or another more predictive powers as to where the economy is heading. In this sense, the long-term outlook the report gives is equally important.
Why does it matter? The information on new orders included in the ISM result is especially insightful as it highlights manufacturing activity for the upcoming time period. While not as useful for detecting inflation as the CPI, the ISM is still considered to be one of the anticipatory indicators of inflation pressure. An ISM trending upwards can suggest a growing economy which makes the currency attractive to Forex traders.
Although the US economy is not primarily an industry-based economy, the ISM is still one of the most important fundamental indicators. Manufacturing still plays a large role in the US economy. Besides, the prices paid and the employment subcomponents of the indicator give a read on what is happening with inflation and the labor market, two very important components of the economy.
Another aspect, and perhaps the most important, is the fact that the manufacturing sector exhibits the first signs of strength or weakness in the economy, since before being sold, products have to be manufactured. For this reason the ISM is considered a leading economic indicator for PPI together with import prices and food and commodity prices.
Released by: Institute for Supply Management. Look for the “Latest manufacturing ROB”.
Frequency: This manufacturing-focused survey is the first report of the month on the economy. It's published on the first business day of the month, covering previous month data. It has no further revisions.
Philadelphia Fed Index
Definition: The Philadelphia Fed Index, also known as the business outlook survey, is a regional Federal Reserve Bank index based on a monthly survey of manufacturers located around the states of Pennsylvania, New Jersey and Delaware.
Participants from companies which are voluntarily surveyed indicate the direction of change in their overall business activity. When the index is above 0 it indicates a factory-sector expansion, and when below 0, it indicates contraction.
Why does it matter? This index is considered to be a good indicator of changes in everything from costs, employment, and conditions within the manufacturing industry. Since manufacturing is a major sector in the US economy, this report has a big influence on the market's behavior. Like some of the other indexes explained above, the Philladelphia Fed index also provides insight on purchasing costs and therefore on inflation.
This survey is widely followed as an indicator of manufacturing sector trends since it is correlated with the ISM survey and the PPI. The results found in the survey can also indicate what to expect from the purchasing managers' index which comes out a few days later and covers the entire US.
There are several regional manufacturing activity indicators around the US, so why is the Philadelphia Fed Index, also called “Philly Fed”, the most important for traders? The reason lies in the correlation of all these regional indexes to the ISM indicator: the Philly Fed is the one with the highest forecasting ability. Philly Fed's performance and forecast potential is due to the fact that it measures its results using the ISM methodology. The many questions that compound the survey often give detailed view on specifics such as new orders and production trends, which often point in a different direction than the general question "are business conditions better or worse than last month?". Another criteria why this indicator is a candidate to forecast the national index is based on one simple reason: unlike many other regional indicators, the Philly Fed is released before the ISM.
Released by: Federal Reserve Bank of Philadelphia. View recent releases of the Business Outlook Survey.
Frequency: This index is published on the third Thursday of the month covering the previous month's data.
Goods and Services Imports
Definition: This index is created by compiling the prices of goods ans services purchased in the US but produced out of country. The figure is reported in headlines in billions of Dollars.
Why does it matter? Although it rarely affects the Forex market directly, the goods and services imports index is used to help measure inflation pressures in products that are traded globally. Inflation can be created by changes in foreign exchange rates. For instance, when the USD is strong, import prices tend to be under downward pressure. Inflation also leads to higher interest rates, and by keeping an eye on this menace, traders following the previously explained monetary model can monitor their investment portfolio.
Along with food and commodity prices and the ISM results, this index can be used to forecast the PPI, resulting in a leading indicator for that index.
Released by: The Census Bureau and the Bureau of Economic Analysis of the Department of Commerce. Raw data available at the Census Bureau.
Frequency: It's typically released in the second week of the month for the prior month.
In the Pracice Part of this Unit, leading indicators for other economies will be disclosed and you will learn how to trade on less known indicators. For example: employment data in New Zealand has a leading indicator which can be used to forecast it, while the Non Farm Payroll Report in the US doesn't have.
The link between different reports can not always be established as a linear cause-effect relationship. It would be relatively easy to make money in the markets if we could reach logical conclusions about the impact that a specific report should have on the exchange rates and then trade accordingly. In reality, the real factors pushing a currency can be quite tricky to identify.
Why does the USD sometimes react in the opposite direction to the reported economical news? Sometimes there is no downward reaction on the USD after a bad economical report for the US has been released...In order to get an explanation as to why markets reacted in an unexpected way, we should read beyond the report and see if there are currently more important factors then the report we were watching.
Ultimately, exchange rates are a reflexion of supply and demand for a certain currency and each component of the news landscape should be used to gain insight on this imbalance. When the current market theme is not related to an indicator or if it is not offering new information to the market participants, the reaction can be relatively neutral even if it is considered as a market moving indicator. Price only adjusts to new information. Therefore it's always useful to know what is the current market theme or discussion, and ask yourself if the report is changing anything in all the previous available information.
It may happen that scheduled economic announcements that are complete surprises render meaningless short-term support and resistance levels. The same can happen with unscheduled or unexpected news, such as statements by government officials, political and social disturbances: the market will react depending upon the severity of what was said or implied.
Keep updated about what the market theme is by following our Fundamental Market View section.
Can I trade before important news? Keep in mind that fundamental analysis is an effective resource to forecast supply and demand for a certain currency, but not to forecast exact exchange rates. So the answer is yes, you can enter the market when a report is about to be released, but you better make a combined use of fundamentals with other analytical resources, as the ones you are taught here in the Learning Center.
For example, you might get a clear understanding of the direction of the US economy by studying the relationship between the trade balance and the gross domestic product, but how do you translate that in entry and exit points? A great starting point is undoubtedly by studying the fundamentals and identifying those edges that you want to trade upon - the herewith disclosed studies are meant as edges on which you can develop your trading model. But in order to find entry and exit points, a combination of those edges with technical strategies is needed. This combination is what you will finally use to translate the raw market data into usable entry and exit points.
In a video titled "Trading Economic Numbers (News Trading)", Adam Rosen explains how to enter positions after the release of economic reports with the use of support and resistance analysis.
The article "How to Trade a News Breakout", written by Chris Capre and published in The Forex Journal, details a simple strategy to trade the release of economic reports with the use of technical analysis.
Here are a few links to key sections on fundamentals:
Table with the World Interest Rates